
 Yahoo Finance
 N Brown Group's(LON:BWNG) Share Price Is Down 84% Over The Past Five Years.

It is doubtless a positive to see that the N Brown Group plc (LON:BWNG) share price has gained some 55% in the last three months. But that doesn't change the fact that the returns over the last half decade have been stomach churning. Five years have seen the share price descend precipitously, down a full 84%. It's true that the recent bounce could signal the company is turning over a new leaf, but we are not so sure. The real question is whether the business can leave its past behind and improve itself over the years ahead.
While a drop like that is definitely a body blow, money isn't as important as health and happiness.
Check out our latest analysis for N Brown Group
There is no denying that markets are sometimes efficient, but prices do not always reflect underlying business performance. By comparing earnings per share (EPS) and share price changes over time, we can get a feel for how investor attitudes to a company have morphed over time.
During five years of share price growth, N Brown Group moved from a loss to profitability. That would generally be considered a positive, so we are surprised to see the share price is down. Other metrics might give us a better handle on how its value is changing over time.
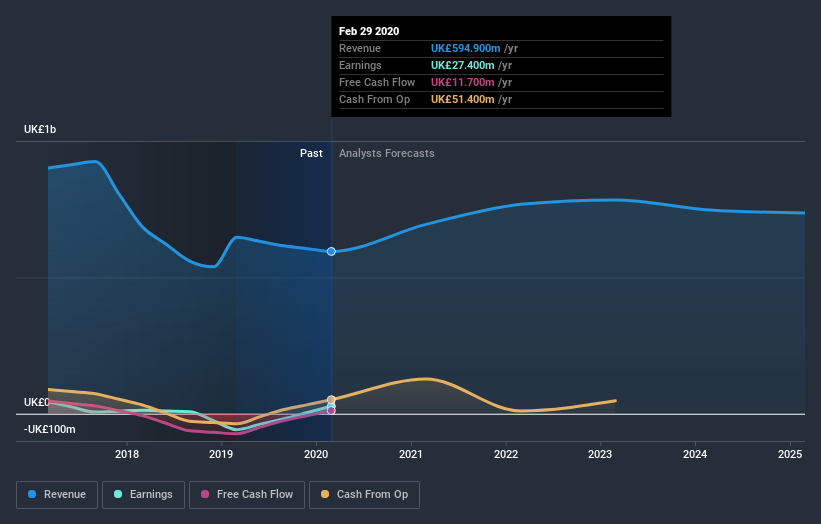
It could be that the revenue decline of 9.6% per year is viewed as evidence that N Brown Group is shrinking. That could explain the weak share price.
The company's revenue and earnings (over time) are depicted in the image below (click to see the exact numbers).
We know that N Brown Group has improved its bottom line lately, but what does the future have in store? You can see what analysts are predicting for N Brown Group in this interactive graph of future profit estimates.
What about the Total Shareholder Return (TSR)?
Investors should note that there's a difference between N Brown Group's total shareholder return (TSR) and its share price change, which we've covered above. Arguably the TSR is a more complete return calculation because it accounts for the value of dividends (as if they were reinvested), along with the hypothetical value of any discounted capital that have been offered to shareholders. Its history of dividend payouts mean that N Brown Group's TSR, which was a 80% drop over the last 5 years, was not as bad as the share price return.
A Different Perspective
We regret to report that N Brown Group shareholders are down 48% for the year. Unfortunately, that's worse than the broader market decline of 8.5%. However, it could simply be that the share price has been impacted by broader market jitters. It might be worth keeping an eye on the fundamentals, in case there's a good opportunity. Unfortunately, last year's performance may indicate unresolved challenges, given that it was worse than the annualised loss of 12% over the last half decade. We realise that Baron Rothschild has said investors should "buy when there is blood on the streets", but we caution that investors should first be sure they are buying a high quality business. It's always interesting to track share price performance over the longer term. But to understand N Brown Group better, we need to consider many other factors. To that end, you should learn about the 4 warning signs we've spotted with N Brown Group (including 2 which is are a bit concerning) .
Of course N Brown Group may not be the best stock to buy. So you may wish to see this free collection of growth stocks.
Please note, the market returns quoted in this article reflect the market weighted average returns of stocks that currently trade on GB exchanges.
This article by Simply Wall St is general in nature. It does not constitute a recommendation to buy or sell any stock, and does not take account of your objectives, or your financial situation. We aim to bring you long-term focused analysis driven by fundamental data. Note that our analysis may not factor in the latest price-sensitive company announcements or qualitative material. Simply Wall St has no position in any stocks mentioned.
Have feedback on this article? Concerned about the content? Get in touch with us directly. Alternatively, email editorial-team@simplywallst.com.
