
 Yahoo Finance
 Is National Express Group PLC's (LON:NEX) High P/E Ratio A Problem For Investors?

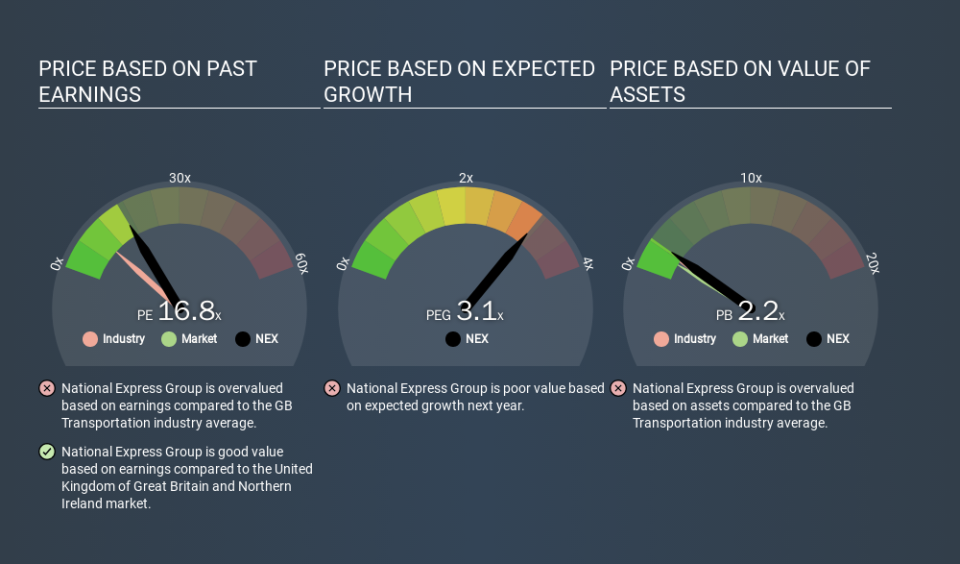
The goal of this article is to teach you how to use price to earnings ratios (P/E ratios). We'll apply a basic P/E ratio analysis to National Express Group PLC's (LON:NEX), to help you decide if the stock is worth further research. National Express Group has a P/E ratio of 16.77, based on the last twelve months. That means that at current prices, buyers pay £16.77 for every £1 in trailing yearly profits.
See our latest analysis for National Express Group
How Do You Calculate A P/E Ratio?
The formula for P/E is:
Price to Earnings Ratio = Share Price ÷ Earnings per Share (EPS)
Or for National Express Group:
P/E of 16.77 = £4.63 ÷ £0.28 (Based on the year to June 2019.)
Is A High Price-to-Earnings Ratio Good?
A higher P/E ratio means that buyers have to pay a higher price for each £1 the company has earned over the last year. That is not a good or a bad thing per se, but a high P/E does imply buyers are optimistic about the future.
How Does National Express Group's P/E Ratio Compare To Its Peers?
The P/E ratio indicates whether the market has higher or lower expectations of a company. As you can see below, National Express Group has a higher P/E than the average company (9.1) in the transportation industry.
Its relatively high P/E ratio indicates that National Express Group shareholders think it will perform better than other companies in its industry classification. Clearly the market expects growth, but it isn't guaranteed. So investors should always consider the P/E ratio alongside other factors, such as whether company directors have been buying shares.
How Growth Rates Impact P/E Ratios
P/E ratios primarily reflect market expectations around earnings growth rates. Earnings growth means that in the future the 'E' will be higher. That means even if the current P/E is high, it will reduce over time if the share price stays flat. A lower P/E should indicate the stock is cheap relative to others -- and that may attract buyers.
National Express Group's earnings per share grew by -2.8% in the last twelve months. And earnings per share have improved by 24% annually, over the last five years.
Don't Forget: The P/E Does Not Account For Debt or Bank Deposits
Don't forget that the P/E ratio considers market capitalization. Thus, the metric does not reflect cash or debt held by the company. The exact same company would hypothetically deserve a higher P/E ratio if it had a strong balance sheet, than if it had a weak one with lots of debt, because a cashed up company can spend on growth.
Spending on growth might be good or bad a few years later, but the point is that the P/E ratio does not account for the option (or lack thereof).
So What Does National Express Group's Balance Sheet Tell Us?
National Express Group has net debt equal to 49% of its market cap. While it's worth keeping this in mind, it isn't a worry.
The Verdict On National Express Group's P/E Ratio
National Express Group trades on a P/E ratio of 16.8, which is fairly close to the GB market average of 17.1. When you consider the modest EPS growth last year (along with some debt), it seems the market thinks the growth is sustainable.
Investors should be looking to buy stocks that the market is wrong about. If the reality for a company is not as bad as the P/E ratio indicates, then the share price should increase as the market realizes this. So this free visualization of the analyst consensus on future earnings could help you make the right decision about whether to buy, sell, or hold.
Of course you might be able to find a better stock than National Express Group. So you may wish to see this free collection of other companies that have grown earnings strongly.
If you spot an error that warrants correction, please contact the editor at editorial-team@simplywallst.com. This article by Simply Wall St is general in nature. It does not constitute a recommendation to buy or sell any stock, and does not take account of your objectives, or your financial situation. Simply Wall St has no position in the stocks mentioned.
We aim to bring you long-term focused research analysis driven by fundamental data. Note that our analysis may not factor in the latest price-sensitive company announcements or qualitative material. Thank you for reading.
