
 Yahoo Finance
 NatWest Group (LON:NWG) investors are sitting on a loss of 3.7% if they invested five years ago
In order to justify the effort of selecting individual stocks, it's worth striving to beat the returns from a market index fund. But the main game is to find enough winners to more than offset the losers At this point some shareholders may be questioning their investment in NatWest Group plc (LON:NWG), since the last five years saw the share price fall 20%. The falls have accelerated recently, with the share price down 13% in the last three months. Of course, this share price action may well have been influenced by the 7.8% decline in the broader market, throughout the period.
Now let's have a look at the company's fundamentals, and see if the long term shareholder return has matched the performance of the underlying business.
View our latest analysis for NatWest Group
While markets are a powerful pricing mechanism, share prices reflect investor sentiment, not just underlying business performance. One flawed but reasonable way to assess how sentiment around a company has changed is to compare the earnings per share (EPS) with the share price.
NatWest Group became profitable within the last five years. Most would consider that to be a good thing, so it's counter-intuitive to see the share price declining. Other metrics may better explain the share price move.
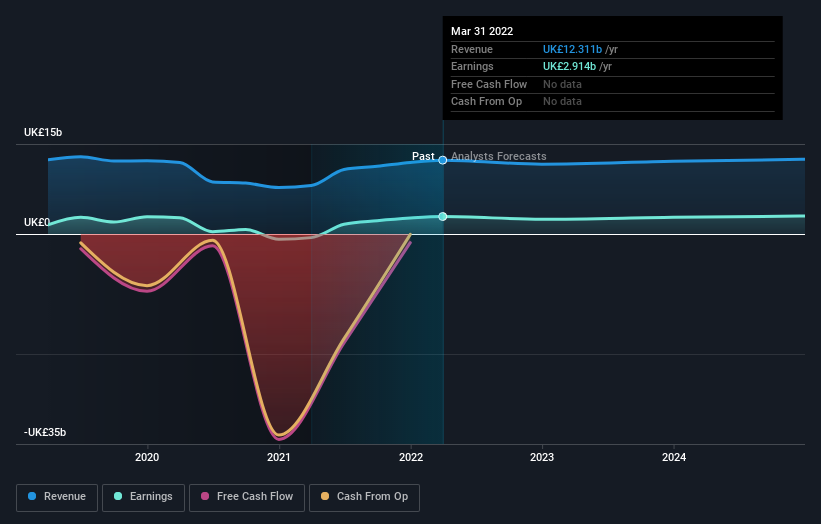
The steady dividend doesn't really explain why the share price is down. It could be that the revenue decline of 5.6% per year is viewed as evidence that NatWest Group is shrinking. With dividends up, but revenue down, some investors might be concluding that the company is no longer growing.
The graphic below depicts how earnings and revenue have changed over time (unveil the exact values by clicking on the image).
NatWest Group is a well known stock, with plenty of analyst coverage, suggesting some visibility into future growth. You can see what analysts are predicting for NatWest Group in this interactive graph of future profit estimates.
What About Dividends?
It is important to consider the total shareholder return, as well as the share price return, for any given stock. Whereas the share price return only reflects the change in the share price, the TSR includes the value of dividends (assuming they were reinvested) and the benefit of any discounted capital raising or spin-off. It's fair to say that the TSR gives a more complete picture for stocks that pay a dividend. In the case of NatWest Group, it has a TSR of -3.7% for the last 5 years. That exceeds its share price return that we previously mentioned. The dividends paid by the company have thusly boosted the total shareholder return.
A Different Perspective
It's nice to see that NatWest Group shareholders have received a total shareholder return of 14% over the last year. And that does include the dividend. That certainly beats the loss of about 0.7% per year over the last half decade. This makes us a little wary, but the business might have turned around its fortunes. While it is well worth considering the different impacts that market conditions can have on the share price, there are other factors that are even more important. Consider for instance, the ever-present spectre of investment risk. We've identified 1 warning sign with NatWest Group , and understanding them should be part of your investment process.
But note: NatWest Group may not be the best stock to buy. So take a peek at this free list of interesting companies with past earnings growth (and further growth forecast).
Please note, the market returns quoted in this article reflect the market weighted average returns of stocks that currently trade on GB exchanges.
Have feedback on this article? Concerned about the content? Get in touch with us directly. Alternatively, email editorial-team (at) simplywallst.com.
This article by Simply Wall St is general in nature. We provide commentary based on historical data and analyst forecasts only using an unbiased methodology and our articles are not intended to be financial advice. It does not constitute a recommendation to buy or sell any stock, and does not take account of your objectives, or your financial situation. We aim to bring you long-term focused analysis driven by fundamental data. Note that our analysis may not factor in the latest price-sensitive company announcements or qualitative material. Simply Wall St has no position in any stocks mentioned.
