
 Yahoo Finance
 Navient (NAVI) Reports Q4 Loss, Surpasses NII Estimates
Navient Corporation NAVI reported the fourth-quarter 2021 core loss per share of 43 cents against the Zacks Consensus Estimate of earnings per share of 85 cents. The reported figure excludes 36 cents from non-recurring items.
A fall in net interest income (NII) and non-interest income, as well as higher expenses, hindered the results. Also, a rise in provisions was a headwind.
Navient’s GAAP net loss was $11 million against the net income of $186 million seen in the prior year.
For the full year, earnings per share were $4.18, comparing favorably with the year-ago earnings of $2.12 per share. Net income available to common shareholders was $717 million, up from $412 million in 2020.
NII Decreases, Provisions and Expenses Flare Up
NII declined 8.5% year over year to $314 million in fourth-quarter 2021. Nonetheless, the reported figure surpassed the Zacks Consensus Estimate of $287.7 million.
In 2021, NII was up 6% from the prior-year level to $1.33 billion. Also, the top line surpassed the Zacks Consensus Estimate of $1.17 billion.
Non-interest income fell 2% to $165 million. The downside mainly stemmed from lower servicing revenues.
Provision for loan losses was an expense of $5 million, marking a year-over-year rise from $2 million witnessed in the prior-year quarter.
Total expenses flared up 76% to $482 million. Higher operating expenses, and a rise in goodwill and acquired intangible asset impairment and amortization expenses primarily resulted in the upswing.
Segmental Performance
Federal Education Loans: The segment generated core earnings of $108 million, down 19.4% year over year.
As of Dec 31, 2021, the company’s net Federal Family Education Loan Program (FFELP) loans were $52.6 billion, down 3.1% sequentially.
Consumer Lending: The segment reported core earnings of $89 million, which decreased 17.6% from the year-ago quarter. Higher provision for loan losses affected the segment’s performance.
Private education loan delinquencies of 30 days or more of $650 million were up 17.3% from the prior-year quarter.
As of Dec 31, 2021, the company’s private education loans totaled $20.2 billion, up marginally from the prior quarter. In addition, Navient originated $1.37 billion of private education refinance loans in the reported quarter.
Business Processing: The segment reported core earnings of $17 million, up 13.3% from $15 million recorded in the year-ago quarter. Higher fee revenues led to the upside.
Liquidity
In order to meet liquidity needs, Navient expects to utilize various sources, including cash and investment portfolio, the predictable operating cash flows provided by operating activities, the repayment of principal on unencumbered student-loan assets, and distributions from securitization trusts. It might also draw down on the secured FFELP Loan and Private Education Loan facilities, issue term asset-backed securities (ABS), enter into additional Private Education Loan ABS repurchase facilities, or issue additional unsecured debt.
Notably, it had $905 million of total unrestricted cash and liquid investments as of Dec 31, 2021.
Capital Deployment Activities
In the fourth quarter, the company paid out $25 million in common stock dividends.
In the reported quarter, Navient repurchased shares of common stock for $150 million. As of Dec 31, 2021, there was $1 billion of the remaining share-repurchase authority.
Our Take
Navient’s performance in the fourth quarter was affected by the non-interest income and NII.In October, the company received all required approvals for its proposal to transfer loan servicing for the ED-owned student loan accounts through a contract novation to Maximus, a government loan servicing company. Maximus replaced Navient as a contractor to the ED, effective Oct 20, 2021.
Nonetheless, the decent performance in its business processing segment was encouraging.
Navient Corporation Price, Consensus and EPS Surprise
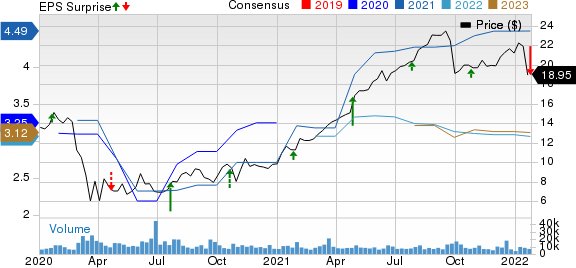
Navient Corporation price-consensus-eps-surprise-chart | Navient Corporation Quote
Currently, Navient carries a Zacks Rank #4 (Sell).
You can see the complete list of today’s Zacks #1 Rank (Strong Buy) stocks here.
Performance of Other Finance Stocks
Texas Capital Bancshares TCBI reported adjusted earnings per share of $1.19 for fourth-quarter 2021, surpassing the Zacks Consensus Estimate of 91 cents. Moreover, results compare favorably with the prior-year quarter’s $1.14.
Robust capital position and lower expenses were the driving factors for TCBI. Moreover, provision for credit losses recorded benefits. Yet, a fall in NII and fee income plus pressed margins were deterrents. Further, Texas Capital’sresults reflect a decline in both loans and deposit balances.
Webster Financial WBS reported fourth-quarter 2021 adjusted earnings per share of $1.31, which surpassed the Zacks Consensus Estimate of $1.10. The reported figure excluded noteworthy items, such as charges related to mergers, strategic optimization and debt prepayment expenses.
Higher NII and fee income drove Webster Financial’s results. Moreover, declining costs, growth in loan balances and impressive capital ratios were positives. Also, the reserve release during the quarter was a tailwind. However, lower net interest margin (NIM) and deposit balance were the key concerns for WBS.
Synovus Financial SNV reported fourth-quarter 2021 adjusted earnings of $1.35 per share, which beat the Zacks Consensus Estimate of $1.1. Also, the bottom line compares favorably with earnings of $1.08 per share recorded in the year-ago quarter.
Synovus’results were driven by rising NII and fee income, lower expenses, and the reversal of provisions. SNV's solid loan and deposit balances stoked organic growth. However, shrinking NIM and deteriorating capital position were the undermining factors.
Want the latest recommendations from Zacks Investment Research? Today, you can download 7 Best Stocks for the Next 30 Days. Click to get this free report
Synovus Financial Corp. (SNV) : Free Stock Analysis Report
Texas Capital Bancshares, Inc. (TCBI) : Free Stock Analysis Report
Webster Financial Corporation (WBS) : Free Stock Analysis Report
Navient Corporation (NAVI) : Free Stock Analysis Report
To read this article on Zacks.com click here.
Zacks Investment Research
