
 Yahoo Finance
 Navigate Bearish Markets With This Pattern
Understanding Bearish Patterns is Critical to Investment Success
Wall Street’s long and illustrious history is littered with a plethora of booms and busts. However, for most investors, bear markets and “Black Swan” events such as the COVID-19 Crash of 2020, the 2022 tech-centric bear market, or the Global Financial Crisis of 2008 tend to be the most memorable. Nevertheless, few investors take advantage of these moments because the market tends to rise in the long run (and a rising tide lifts most ships), they lack proper pattern recognition, or they look to short strong stocks.
Whether you are interested in catching a downswing or simply avoiding it, understanding the bear flag pattern is integral to surviving soft equity periods. Below are some key factors to look for:
Relative Weakness/Downtrend
Anyone who has been around Wall Street long enough has likely learned through the “school of hard knocks” that “catching a falling knife” or trying to buy low and sell high is much more difficult than it seems on the surface. The same can be said for shorting – shorting stocks in an uptrend is much more difficult than shorting stocks in a downtrend.
How Do I Know My Stock is in a Downtrend?
“My metric for everything I look at is the 200-day moving average of closing prices. I’ve seen too many things go to zero, stocks and commodities. The whole trick to investing is: How do I keep from losing everything? If you use the 200-day moving average rule, then you get out.”
The simplest way to gauge whether or not your stock is in a downtrend is to leverage the 200-day moving average and look for stocks trending below it.
Anatomy of a Bear Flag
In my two decades of investing experience, I have discovered that the bear flag pattern is the most reliable bearish pattern and has a far higher hit rate than some of the mainstream bear patterns, such as a “head and shoulders” or “double top” pattern.”
For the bear flag pattern, you want to look for a sharp break lower on heavy volume, followed by a weak counter-trend rally to the 50-day moving average (or 10-week MA on the weekly chart). Ideally, the stock you are looking to short has deteriorating fundamentals and/or negative news catalysts to accompany the poor price action – affording you every advantage possible. Below are two examples:
Herbalife (HLF)

Image Source: TradingView
Meanwhile, from a fundamental perspective, HLF had seen declining earnings, legal troubles, and a worse-possible Zacks Rank #5 (Strong Sell).
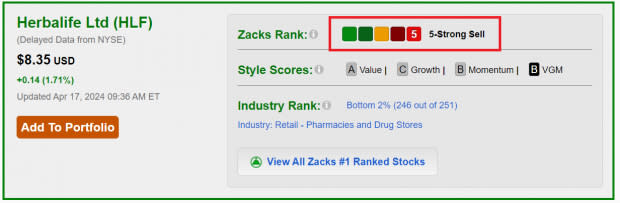
Image Source: Zacks Investment Research
Boeing (BA)
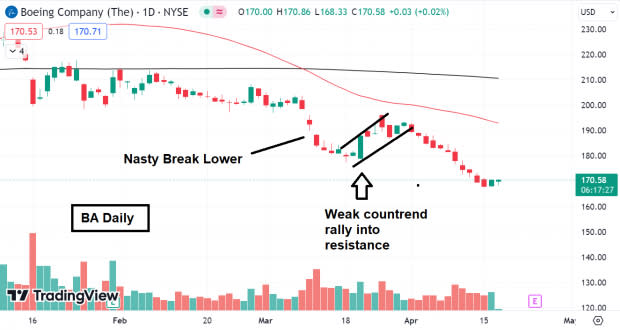
Image Source: TradingView
Fundamentally, BA has seen weakening sales amidst a spat of quality-control issues.
Bottom Line
It’s critical for investors to recognize bearish patterns to survive downtrending bearish markets. The bear flag pattern is simple and easy to identify, and is the most effective bearish technical pattern.
Want the latest recommendations from Zacks Investment Research? Today, you can download 7 Best Stocks for the Next 30 Days. Click to get this free report
The Boeing Company (BA) : Free Stock Analysis Report
Herbalife Ltd (HLF) : Free Stock Analysis Report
