
 Yahoo Finance
 Is NCC Group plc's (LON:NCC) ROE Of 7.8% Concerning?

Want to participate in a short research study? Help shape the future of investing tools and you could win a $250 gift card!
Many investors are still learning about the various metrics that can be useful when analysing a stock. This article is for those who would like to learn about Return On Equity (ROE). We'll use ROE to examine NCC Group plc (LON:NCC), by way of a worked example.
NCC Group has a ROE of 7.8%, based on the last twelve months. Another way to think of that is that for every £1 worth of equity in the company, it was able to earn £0.078.
Check out our latest analysis for NCC Group
How Do You Calculate ROE?
The formula for ROE is:
Return on Equity = Net Profit ÷ Shareholders' Equity
Or for NCC Group:
7.8% = UK£16m ÷ UK£209m (Based on the trailing twelve months to November 2018.)
Most know that net profit is the total earnings after all expenses, but the concept of shareholders' equity is a little more complicated. It is the capital paid in by shareholders, plus any retained earnings. The easiest way to calculate shareholders' equity is to subtract the company's total liabilities from the total assets.
What Does ROE Mean?
ROE measures a company's profitability against the profit it retains, and any outside investments. The 'return' is the amount earned after tax over the last twelve months. That means that the higher the ROE, the more profitable the company is. So, all else being equal, a high ROE is better than a low one. Clearly, then, one can use ROE to compare different companies.
Does NCC Group Have A Good ROE?
Arguably the easiest way to assess company's ROE is to compare it with the average in its industry. However, this method is only useful as a rough check, because companies do differ quite a bit within the same industry classification. As is clear from the image below, NCC Group has a lower ROE than the average (15%) in the IT industry.
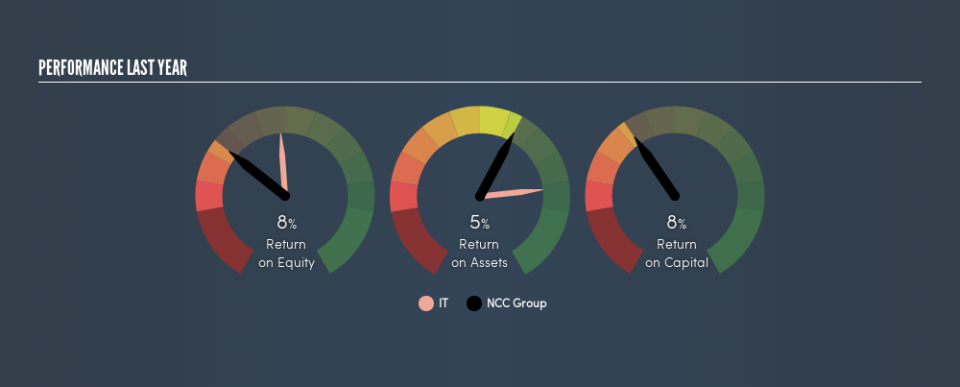
That certainly isn't ideal. It is better when the ROE is above industry average, but a low one doesn't necessarily mean the business is overpriced. Nonetheless, it could be useful to double-check if insiders have sold shares recently.
How Does Debt Impact ROE?
Virtually all companies need money to invest in the business, to grow profits. That cash can come from issuing shares, retained earnings, or debt. In the first two cases, the ROE will capture this use of capital to grow. In the latter case, the use of debt will improve the returns, but will not change the equity. In this manner the use of debt will boost ROE, even though the core economics of the business stay the same.
Combining NCC Group's Debt And Its 7.8% Return On Equity
NCC Group has a debt to equity ratio of 0.29, which is far from excessive. Its ROE isn't particularly impressive, but the debt levels are quite modest, so the business probably has some real potential. Careful use of debt to boost returns is often very good for shareholders. However, it could reduce the company's ability to take advantage of future opportunities.
The Bottom Line On ROE
Return on equity is a useful indicator of the ability of a business to generate profits and return them to shareholders. In my book the highest quality companies have high return on equity, despite low debt. If two companies have the same ROE, then I would generally prefer the one with less debt.
But when a business is high quality, the market often bids it up to a price that reflects this. It is important to consider other factors, such as future profit growth -- and how much investment is required going forward. So you might want to take a peek at this data-rich interactive graph of forecasts for the company.
Of course, you might find a fantastic investment by looking elsewhere. So take a peek at this free list of interesting companies.
We aim to bring you long-term focused research analysis driven by fundamental data. Note that our analysis may not factor in the latest price-sensitive company announcements or qualitative material.
If you spot an error that warrants correction, please contact the editor at editorial-team@simplywallst.com. This article by Simply Wall St is general in nature. It does not constitute a recommendation to buy or sell any stock, and does not take account of your objectives, or your financial situation. Simply Wall St has no position in the stocks mentioned. Thank you for reading.
