
 Yahoo Finance
 NCI Building (NCS) Beats on Q2 Earnings & Sales Estimates


NCI Building Systems, Inc. NCS delivered adjusted earnings of 25 cents per share for second-quarter fiscal 2018 (ended Apr 29, 2018), which surged around 56% from 16 cents recorded in the prior-year quarter. Earnings also comfortably beat the Zacks Consensus Estimate of 18 cents.
Including one-time items, the company posted a loss of 9 cents per share against earnings of 24 cents a share reported in the year-ago quarter.
Operational Update
Sales rose 8.7% year over year to $457 million in the quarter. Revenues surpassed the Zacks Consensus Estimate of $443 million and came close to the top end of management’s guided range of $430-$450 million. This year-over-year growth was driven by continued commercial discipline in the pass-through of higher material costs across all segments, combined with strong volume growth in the Metal Components and Insulated Metal Panels (IMP) segments and growth in package volumes in the Metal Coil Coating segment.
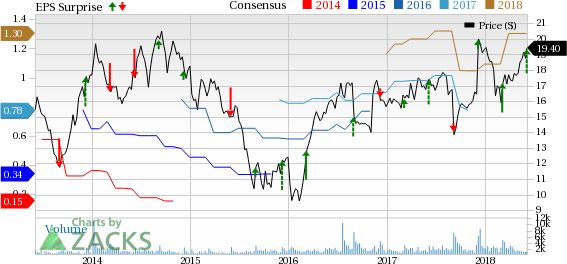
NCI Building Systems, Inc. Price, Consensus and EPS Surprise
NCI Building Systems, Inc. Price, Consensus and EPS Surprise | NCI Building Systems, Inc. Quote
Cost of sales rose 10% year over year to $353 million from $320 million in the year-ago quarter. Gross profit increased 3.2% year over year to $104 million. However, gross margin contracted 120 basis points (bps) to 22.8% in the quarter, primarily as a result of less favorable product mix in the IMP segment and incremental manufacturing costs in the Metal Coil Coating segment
Engineering, selling, general and administrative expenses dipped 1% year over year to $74 million. The company reported adjusted operating income of $27 million, which jumped 15% from $24 million recorded in the year-ago quarter. Operating margin came in at 6%, expanding 40 bps year over year.
Segment Performance
Revenues in the Engineered Building Systems segment rose 3% to $167 million from $163 million generated in the year-earlier quarter. The segment reported adjusted operating income of $10 million, up 32% from $7 million in the year-ago quarter.
The Metal Component segment’s revenues moved up 9% year over year to $169 million. On an adjusted basis, operating profit improved 12.7% year over year to $22 million.
The IMP segment reported revenues of $113 million, up 10% year over year. Adjusted operating profit declined 19% year over year to $8 million.
The Metal Coil Coating segment reported revenues of $95 million, which improved 10% year over year. Adjusted operating profit grew 14% year over year to $7 million.
Financial Update
NCI Building ended the reported quarter with cash and cash equivalents of $35 million compared with $50 million recorded in the year-ago quarter. Cash flow from operations came in at $40 million during the six-month period ended Apr 29, 2018, compared with $8 million reported in the comparable period last year. Its long-term debt was $409 million as of Apr 29, 2018, compared with $387 million as of Oct 29, 2017.
NCI Building’s consolidated backlog advanced 11% year over year to $632 million at the end of the reported quarter. Its net debt leverage ratio at the end of the fiscal second quarter was 2.2x.
Outlook
NCI Building remains optimistic about fiscal 2018 supported by bookings and backlog strength, as well as encouraging economic indicators. For third-quarter fiscal 2018, the company estimates revenues to be $525-$545 million and adjusted EBITDA of $56-$66 million. NCI Building is poised to gain from its focus on executing advanced manufacturing and improvement initiatives.
Share Price Performance
Over the past three months, NCI Building has outperformed its industry with respect to price performance. The stock has gained around 20%, while the industry recorded growth of 4%.
Zacks Rank & Key Picks
NCI Building currently carries a Zacks Rank #3 (Hold).
Better-ranked stocks in the same industry include Installed Building Products, Inc. IBP, PGT, Inc. PGTI and Patrick Industries, Inc. PATK. All three stocks sport a Zacks Rank #1 (Strong Buy). You can see the complete list of today’s Zacks #1 Rank stocks here.
Installed Building Products has a long-term earnings growth rate of 30%. Its shares have rallied 20%, over the past year.
PGT has a long-term earnings growth rate of 19.3%. The company’s shares have appreciated 74% during the same time frame.
Patrick Industries has a long-term earnings growth rate of 12.7%. The stock has gained 25% in a year’s time.
Today's Stocks from Zacks' Hottest Strategies
It's hard to believe, even for us at Zacks. But while the market gained +21.9% in 2017, our top stock-picking screens have returned +115.0%, +109.3%, +104.9%, +98.6%, and +67.1%.
And this outperformance has not just been a recent phenomenon. Over the years it has been remarkably consistent. From 2000 - 2017, the composite yearly average gain for these strategies has beaten the market more than 19X over. Maybe even more remarkable is the fact that we're willing to share their latest stocks with you without cost or obligation.
See Them Free>>
Want the latest recommendations from Zacks Investment Research? Today, you can download 7 Best Stocks for the Next 30 Days. Click to get this free report
NCI Building Systems, Inc. (NCS) : Free Stock Analysis Report
PGT, Inc. (PGTI) : Free Stock Analysis Report
Installed Building Products, Inc. (IBP) : Free Stock Analysis Report
Patrick Industries, Inc. (PATK) : Free Stock Analysis Report
To read this article on Zacks.com click here.
