
 Yahoo Finance
 Neptune Wellness Solutions Stock Gives Every Indication Of Being Possible Value Trap
- By GF Value
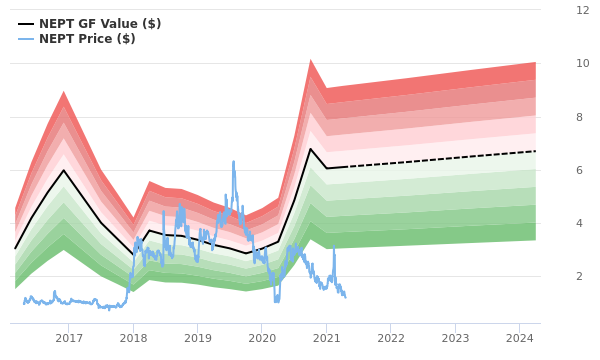
The stock of Neptune Wellness Solutions (NAS:NEPT, 30-year Financials) is estimated to be possible value trap, according to GuruFocus Value calculation. GuruFocus Value is GuruFocus' estimate of the fair value at which the stock should be traded. It is calculated based on the historical multiples that the stock has traded at, the past business growth and analyst estimates of future business performance. If the price of a stock is significantly above the GF Value Line, it is overvalued and its future return is likely to be poor. On the other hand, if it is significantly below the GF Value Line, its future return will likely be higher. At its current price of $1.2 per share and the market cap of $195.2 million, Neptune Wellness Solutions stock shows every sign of being possible value trap. GF Value for Neptune Wellness Solutions is shown in the chart below.
The reason we think that Neptune Wellness Solutions stock might be a value trap is because Neptune Wellness Solutions has an Altman Z-score of 0.35, which indicates that the financial condition of the company is in the distressed zone and implies a higher risk of bankruptcy. An Altman Z-score of above 2.99 would be better, indicating safe financial conditions. To learn more about how the Z-score measures the financial risk of the company, please go here.
Link: These companies may deliever higher future returns at reduced risk.
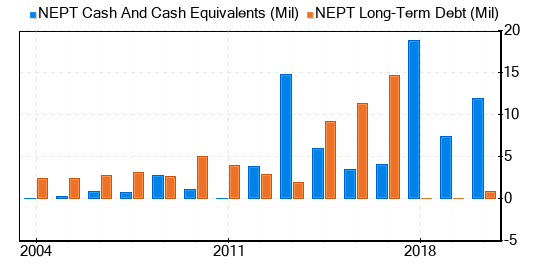
Companies with poor financial strength offer investors a high risk of permanent capital loss. To avoid permanent capital loss, an investor must do their research and review a company's financial strength before deciding to purchase shares. Both the cash-to-debt ratio and interest coverage of a company are a great way to to understand its financial strength. Neptune Wellness Solutions has a cash-to-debt ratio of 7.21, which which ranks better than 74% of the companies in Drug Manufacturers industry. The overall financial strength of Neptune Wellness Solutions is 6 out of 10, which indicates that the financial strength of Neptune Wellness Solutions is fair. This is the debt and cash of Neptune Wellness Solutions over the past years:
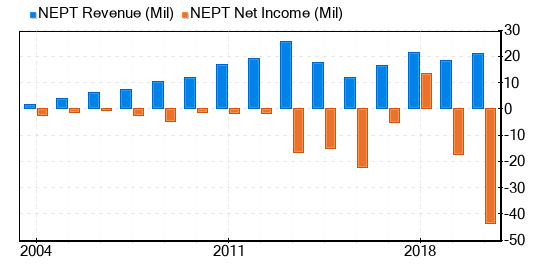
Companies that have been consistently profitable over the long term offer less risk for investors who may want to purchase shares. Higher profit margins usually dictate a better investment compared to a company with lower profit margins. Neptune Wellness Solutions has been profitable 1 over the past 10 years. Over the past twelve months, the company had a revenue of $46.9 million and loss of $1.023 a share. Its operating margin is -168.44%, which ranks worse than 85% of the companies in Drug Manufacturers industry. Overall, the profitability of Neptune Wellness Solutions is ranked 2 out of 10, which indicates poor profitability. This is the revenue and net income of Neptune Wellness Solutions over the past years:
Growth is probably the most important factor in the valuation of a company. GuruFocus research has found that growth is closely correlated with the long term stock performance of a company. A faster growing company creates more value for shareholders, especially if the growth is profitable. The 3-year average annual revenue growth of Neptune Wellness Solutions is 3.2%, which ranks in the middle range of the companies in Drug Manufacturers industry. The 3-year average EBITDA growth rate is -66%, which ranks in the bottom 10% of the companies in Drug Manufacturers industry.
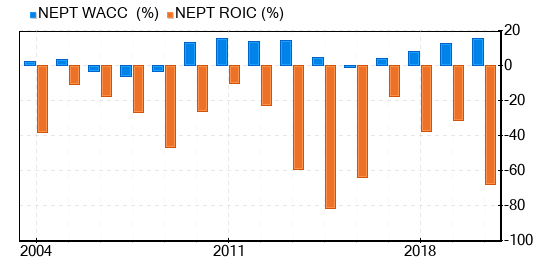
Another way to look at the profitability of a company is to compare its return on invested capital and the weighted cost of capital. Return on invested capital (ROIC) measures how well a company generates cash flow relative to the capital it has invested in its business. The weighted average cost of capital (WACC) is the rate that a company is expected to pay on average to all its security holders to finance its assets. We want to have the return on invested capital higher than the weighted cost of capital. For the past 12 months, Neptune Wellness Solutions's return on invested capital is -73.75, and its cost of capital is 13.42. The historical ROIC vs WACC comparison of Neptune Wellness Solutions is shown below:
Overall, The stock of Neptune Wellness Solutions (NAS:NEPT, 30-year Financials) appears to be possible value trap. The company's financial condition is fair and its profitability is poor. Its growth ranks in the bottom 10% of the companies in Drug Manufacturers industry. To learn more about Neptune Wellness Solutions stock, you can check out its 30-year Financials here.
To find out the high quality companies that may deliever above average returns, please check out GuruFocus High Quality Low Capex Screener.
This article first appeared on GuruFocus.
