
 Yahoo Finance
 Nestle SA's Dividend Analysis
Understanding Nestle SA's Upcoming Dividend Payout
Nestle SA (NSRGY) recently announced a dividend of $3.41 per share, payable on 0000-00-00, with the ex-dividend date set for 2024-04-22. As investors look forward to this upcoming payment, the spotlight also shines on the company's dividend history, yield, and growth rates. Using the data from GuruFocus, let's look into Nestle SA's dividend performance and assess its sustainability.
What Does Nestle SA Do?
This Powerful Chart Made Peter Lynch 29% A Year For 13 Years
How to calculate the intrinsic value of a stock?
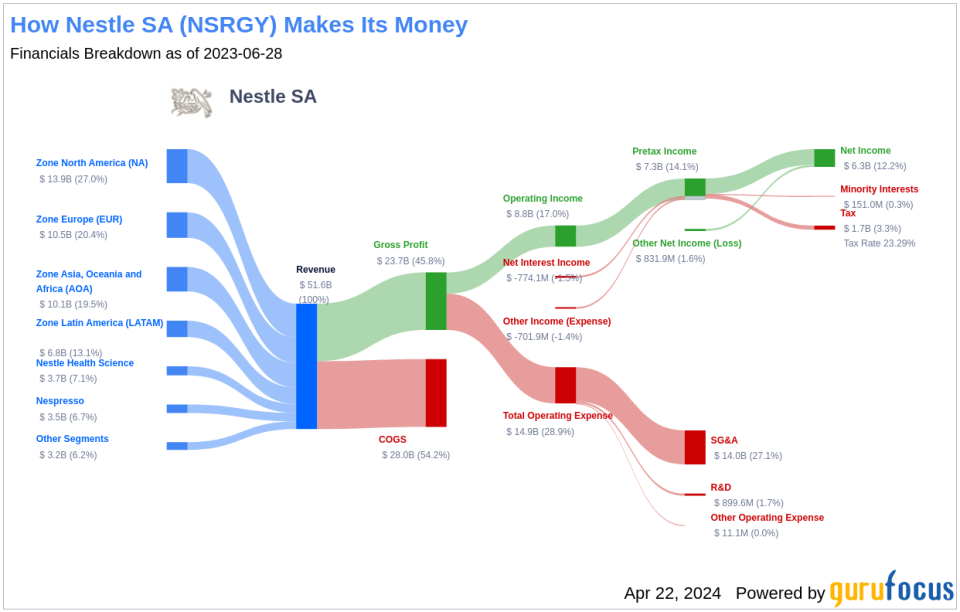
With a 150-year-plus history, Nestle SA is the largest food and beverage manufacturer in the world by sales, generating more than CHF 90 billion in annual revenue. Its diverse product portfolio includes brands such as Nestle, Nescafe, Perrier, Pure Life, and Purina. Nestle SA also owns around 20% of French cosmetics firm L'Oreal. The company employs 275,000 people around the world and has a vast portfolio of global products, with more than 30 brands each achieving more than CHF 1 billion in sales annually and a geographic presence that spans almost 190 countries.
A Glimpse at Nestle SA's Dividend History
Nestle SA has maintained a consistent dividend payment record since 1994. Dividends are currently distributed on a yearly basis. Nestle SA has increased its dividend each year since 2010. The stock is thus listed as a dividend achiever, an honor that is given to companies that have increased their dividend each year for at least the past 14 years. Below is a chart showing annual Dividends Per Share for tracking historical trends.
Breaking Down Nestle SA's Dividend Yield and Growth
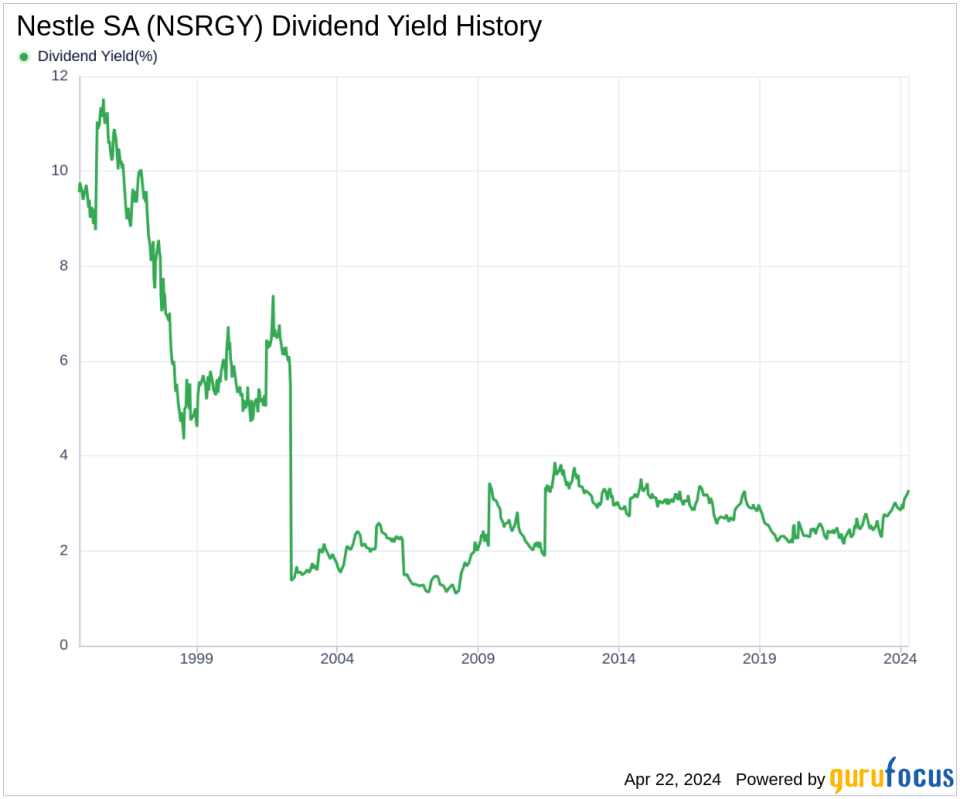
As of today, Nestle SA currently has a 12-month trailing dividend yield of 3.18% and a 12-month forward dividend yield of 3.27%. This suggests an expectation of increased dividend payments over the next 12 months.
Over the past three years, Nestle SA's annual dividend growth rate was 3.00%. Extended to a five-year horizon, this rate increased to 4.60% per year. And over the past decade, Nestle SA's annual dividends per share growth rate stands at 3.70%.
Based on Nestle SA's dividend yield and five-year growth rate, the 5-year yield on cost of Nestle SA stock as of today is approximately 3.98%.
The Sustainability Question: Payout Ratio and Profitability
To assess the sustainability of the dividend, one needs to evaluate the company's payout ratio. The dividend payout ratio provides insights into the portion of earnings the company distributes as dividends. A lower ratio suggests that the company retains a significant part of its earnings, thereby ensuring the availability of funds for future growth and unexpected downturns. As of 2023-12-31, Nestle SA's dividend payout ratio is 0.61.
Nestle SA's profitability rank, offers an understanding of the company's earnings prowess relative to its peers. GuruFocus ranks Nestle SA's profitability 8 out of 10 as of 2023-12-31, suggesting good profitability prospects. The company has reported positive net income for each of year over the past decade, further solidifying its high profitability.
Growth Metrics: The Future Outlook
To ensure the sustainability of dividends, a company must have robust growth metrics. Nestle SA's growth rank of 8 out of 10 suggests that the company's growth trajectory is good relative to its competitors.
Revenue is the lifeblood of any company, and Nestle SA's revenue per share, combined with the 3-year revenue growth rate, indicates a strong revenue model. Nestle SA's revenue has increased by approximately 5.90% per year on average, a rate that underperforms than approximately 55.13% of global competitors.
The company's 3-year EPS growth rate showcases its capability to grow its earnings, a critical component for sustaining dividends in the long run. During the past three years, Nestle SA's earnings increased by approximately 5.50% per year on average, a rate that underperforms than approximately 52.23% of global competitors.
Lastly, the company's 5-year EBITDA growth rate of 6.20%, which underperforms than approximately 50% of global competitors.
Next Steps
Considering Nestle SA's consistent dividend payments, steady dividend growth rate, manageable payout ratio, strong profitability, and growth metrics, the company's dividend appears to be sustainable. Investors looking for steady income streams may find Nestle SA an attractive option, provided the company continues to maintain its financial health and market position. As always, it is crucial for investors to conduct their due diligence and consider the broader economic context when making investment decisions. For those seeking to expand their portfolio with dividend-paying stocks, GuruFocus Premium users can screen for high-dividend yield stocks using the High Dividend Yield Screener.
This article, generated by GuruFocus, is designed to provide general insights and is not tailored financial advice. Our commentary is rooted in historical data and analyst projections, utilizing an impartial methodology, and is not intended to serve as specific investment guidance. It does not formulate a recommendation to purchase or divest any stock and does not consider individual investment objectives or financial circumstances. Our objective is to deliver long-term, fundamental data-driven analysis. Be aware that our analysis might not incorporate the most recent, price-sensitive company announcements or qualitative information. GuruFocus holds no position in the stocks mentioned herein.
This article first appeared on GuruFocus.
