
 Yahoo Finance
 NetApp (NTAP) Q4 Earnings Top Estimates, Revenues Fall Y/Y
NetApp, Inc NTAP reported fourth-quarter fiscal 2023 non-GAAP earnings of $1.54 per share, which surpassed the Zacks Consensus Estimate by 14.1%. The bottom line increased 8.5% year over year. Management anticipated non-GAAP earnings in the range of $1.30-$1.40 per share.
Revenues of $1.58 billion decreased 6% and 4%, on a reported basis and in constant currency, respectively, year over year. NTAP projected revenues in the range of $1.475-$1.625 billion. Revenues beat the consensus mark by 2.4%.
NetApp now expects fiscal 2024 revenues to decline in the low-to-mid single digits range on a year-over-year basis. Weakening IT spending environment and cloud cost optimization amid macroeconomic turbulence weigh on the performance along with forex volatility. Management believes that these are temporary headwinds and expects IT spending to rebound in time.
NetApp, Inc. Price, Consensus and EPS Surprise

NetApp, Inc. price-consensus-eps-surprise-chart | NetApp, Inc. Quote
The company anticipates non-GAAP earnings for fiscal 2024 to be between $5.65 per share and $5.85 per share. The Zacks Consensus Estimate for fiscal 2024 earnings is pegged at $5.48.
For fiscal 2024, NetApp expects non-GAAP gross margin to be nearly 70% and non-GAAP operating margin to be nearly 25%.
Following the announcement, shares were up 4.8% in the pre-market trading on Jun 1. In the past year, shares have lost 9% compared with sub-industry’s decline of 2.6%.
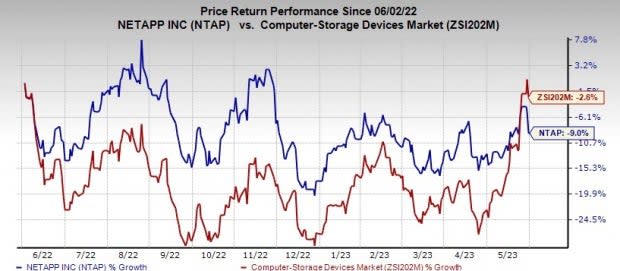
Image Source: Zacks Investment Research
Top-Line Details
NetApp introduced two segments for financial reporting, namely, Hybrid Cloud and Public Cloud.
The Hybrid Cloud segment consists of revenues from enterprise datacenter business, which include product, support and professional services.
The Public Cloud segment consists of revenues from products, which are delivered as-a-service and include related support. The portfolio includes cloud automation and optimization services, storage services and cloud infrastructure monitoring services.
Revenues from the Hybrid Cloud segment were down 8% year over year to $1.43 billion. The Public Cloud segment’s revenues were up 25.8% from the year-ago quarter’s levels to $151 million.
Within the Hybrid Cloud segment, Product revenues (52% of segmental revenues) decreased 16.8% year over year to $744 million.
Revenues from Support Contracts (41.8%) totaled $598 million, up 1.4% year over year. Professional and Other Services revenues (6.2%) were $88 million, rose 15.8% year over year.
Software product revenues amounted to $437 million, down 17.5%.
Region-wise, the Americas, Europe, the Middle East and Africa and the Asia Pacific contributed 52%, 34% and 14% to total revenues, respectively.
Direct and Indirect revenues contributed 22% and 78%, respectively, to total revenues.
Key Metrics
During the fiscal fourth quarter, the company’s All-Flash Array Business’ annualized net revenue run rate was $3.1 billion, down 4% year over year. Total billings decreased 17% year over year to $1.7 billion. Deferred revenues were $4.3 billion, up 2% year over year.
Public Cloud Services recorded annualized recurring revenues (ARR) of $620 million, up 23% year over year, driven by strength in Public Cloud storage services.
Operating Details
Non-GAAP gross margin was 69%, expanded 330 basis points (bps) from the year-ago quarter’s levels.
The Hybrid segment’s gross margin was 69.4%, which expanded 400 bps year over year. The Public Cloud segment’s gross margin was 65.6%, which contracted 270 bps year over year.
Non-GAAP operating expenses were down 6.1% year over year to $677 million. As a percentage of net revenues, the figure remained flat on a year-over-year basis to 42.9%.
Non-GAAP operating income increased 8.4% year over year to $414 million. Non-GAAP operating margin expanded 350 bps to 26.2%.
Balance Sheet & Cash Flow
NetApp exited the quarter ending Apr 28, 2023, with $3.07 billion in cash, cash equivalents and investments compared with $3.141 billion as of Jan 27. Long-term debt was $2.389 billion compared with $2.388 billion as of Jan 27.
Net cash from operations was $235 million during the reported quarter compared with $377 million in the previous quarter.
Free cash flow was $196 million (free cash flow margin of 12.4%) compared with $319 million in the previous quarter (free cash flow margin of 20.9%).
The company returned $256 million to shareholders as dividend payouts and share repurchases in the fiscal fourth quarter.
NTAP also announced a dividend of 50 cents payable on Jul 26, to shareholders of record as of the close of business on Jul 7.
Q1 2024 Guidance
Management projects non-GAAP earnings to be between $1.00 per share and $1.10 per share. The Zacks Consensus Estimate is pegged at $1.19.
Net revenues are anticipated to be in the range of $1.325-$1.475 billion. The Zacks Consensus Estimate is pegged at $1.46 billion.
Zacks Rank & Stocks to Consider
NetApp currently carries a Zacks Rank #3 (Hold)
Some better-ranked stocks in the broader technology space are Dropbox DBX, Badger Meter BMI and Blackbaud BLKB. Dropbox and Badger Meter sport a Zacks Rank #1 (Strong Buy), whereas Blackbaud carries a Zacks Rank #2 (Buy). You can see the complete list of today’s Zacks #1 Rank stocks here.
The Zacks Consensus Estimate for Dropbox’s 2023 earnings has increased 10.1% in the past 60 days to $1.85 per share. The long-term earnings growth rate is anticipated to be 12.3%.
Dropbox’s earnings beat the Zacks Consensus Estimate in the last four quarters, the average being 10.4%. Shares of DBX have gained 7.1% in the past year.
The Zacks Consensus Estimate for Badger Meter’s 2023 earnings has improved 4.7% in the past 60 days to $2.69 per share.
Badger Meter’s earnings beat the Zacks Consensus Estimate in all the last four quarters, the average being 5.3%. Shares of BMI have surged 67.6% in the past year.
The Zacks Consensus Estimate for Blackbaud’s 2023 earnings has risen 9.3% in the past 60 days to $3.75 per share.
Blackbaud’s earnings beat the Zacks Consensus Estimate in the last four quarters, the average surprise being 10.4%. Shares of BLKB have increased 12.3% in the past year.
Want the latest recommendations from Zacks Investment Research? Today, you can download 7 Best Stocks for the Next 30 Days. Click to get this free report
Badger Meter, Inc. (BMI) : Free Stock Analysis Report
NetApp, Inc. (NTAP) : Free Stock Analysis Report
Blackbaud, Inc. (BLKB) : Free Stock Analysis Report
Dropbox, Inc. (DBX) : Free Stock Analysis Report
