
 Yahoo Finance
 What Is NetSol Technologies's (NASDAQ:NTWK) P/E Ratio After Its Share Price Rocketed?

Those holding NetSol Technologies (NASDAQ:NTWK) shares must be pleased that the share price has rebounded 32% in the last thirty days. But unfortunately, the stock is still down by 27% over a quarter. But that will do little to salve the savage burn caused by the 57% share price decline, over the last year.
Assuming no other changes, a sharply higher share price makes a stock less attractive to potential buyers. While the market sentiment towards a stock is very changeable, in the long run, the share price will tend to move in the same direction as earnings per share. So some would prefer to hold off buying when there is a lot of optimism towards a stock. One way to gauge market expectations of a stock is to look at its Price to Earnings Ratio (PE Ratio). Investors have optimistic expectations of companies with higher P/E ratios, compared to companies with lower P/E ratios.
View our latest analysis for NetSol Technologies
Does NetSol Technologies Have A Relatively High Or Low P/E For Its Industry?
We can tell from its P/E ratio of 10.71 that sentiment around NetSol Technologies isn't particularly high. We can see in the image below that the average P/E (44.7) for companies in the software industry is higher than NetSol Technologies's P/E.
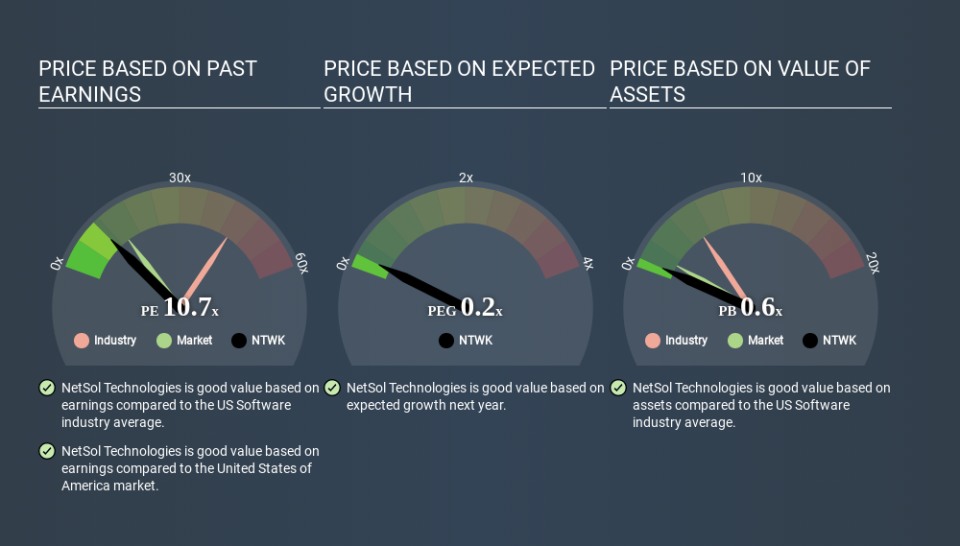
Its relatively low P/E ratio indicates that NetSol Technologies shareholders think it will struggle to do as well as other companies in its industry classification. Since the market seems unimpressed with NetSol Technologies, it's quite possible it could surprise on the upside. If you consider the stock interesting, further research is recommended. For example, I often monitor director buying and selling.
How Growth Rates Impact P/E Ratios
Probably the most important factor in determining what P/E a company trades on is the earnings growth. Earnings growth means that in the future the 'E' will be higher. Therefore, even if you pay a high multiple of earnings now, that multiple will become lower in the future. Then, a lower P/E should attract more buyers, pushing the share price up.
NetSol Technologies saw earnings per share decrease by 49% last year. But it has grown its earnings per share by 134% per year over the last three years.
Don't Forget: The P/E Does Not Account For Debt or Bank Deposits
Don't forget that the P/E ratio considers market capitalization. Thus, the metric does not reflect cash or debt held by the company. In theory, a company can lower its future P/E ratio by using cash or debt to invest in growth.
Spending on growth might be good or bad a few years later, but the point is that the P/E ratio does not account for the option (or lack thereof).
NetSol Technologies's Balance Sheet
With net cash of US$6.6m, NetSol Technologies has a very strong balance sheet, which may be important for its business. Having said that, at 19% of its market capitalization the cash hoard would contribute towards a higher P/E ratio.
The Bottom Line On NetSol Technologies's P/E Ratio
NetSol Technologies has a P/E of 10.7. That's below the average in the US market, which is 14.2. Falling earnings per share are likely to be keeping potential buyers away, the healthy balance sheet means the company retains potential for future growth. If that occurs, the current low P/E could prove to be temporary. What is very clear is that the market has become more optimistic about NetSol Technologies over the last month, with the P/E ratio rising from 8.1 back then to 10.7 today. For those who prefer to invest with the flow of momentum, that might mean it's time to put the stock on a watchlist, or research it. But the contrarian may see it as a missed opportunity.
Investors have an opportunity when market expectations about a stock are wrong. If it is underestimating a company, investors can make money by buying and holding the shares until the market corrects itself. So this free visual report on analyst forecasts could hold the key to an excellent investment decision.
Of course you might be able to find a better stock than NetSol Technologies. So you may wish to see this free collection of other companies that have grown earnings strongly.
If you spot an error that warrants correction, please contact the editor at editorial-team@simplywallst.com. This article by Simply Wall St is general in nature. It does not constitute a recommendation to buy or sell any stock, and does not take account of your objectives, or your financial situation. Simply Wall St has no position in the stocks mentioned.
We aim to bring you long-term focused research analysis driven by fundamental data. Note that our analysis may not factor in the latest price-sensitive company announcements or qualitative material. Thank you for reading.
