
 Yahoo Finance
 Netwealth Group's (ASX:NWL) investors will be pleased with their splendid 126% return over the last five years
When you buy shares in a company, it's worth keeping in mind the possibility that it could fail, and you could lose your money. But on the bright side, you can make far more than 100% on a really good stock. For example, the Netwealth Group Limited (ASX:NWL) share price has soared 110% in the last half decade. Most would be very happy with that. On top of that, the share price is up 10% in about a quarter.
So let's assess the underlying fundamentals over the last 5 years and see if they've moved in lock-step with shareholder returns.
View our latest analysis for Netwealth Group
In his essay The Superinvestors of Graham-and-Doddsville Warren Buffett described how share prices do not always rationally reflect the value of a business. One way to examine how market sentiment has changed over time is to look at the interaction between a company's share price and its earnings per share (EPS).
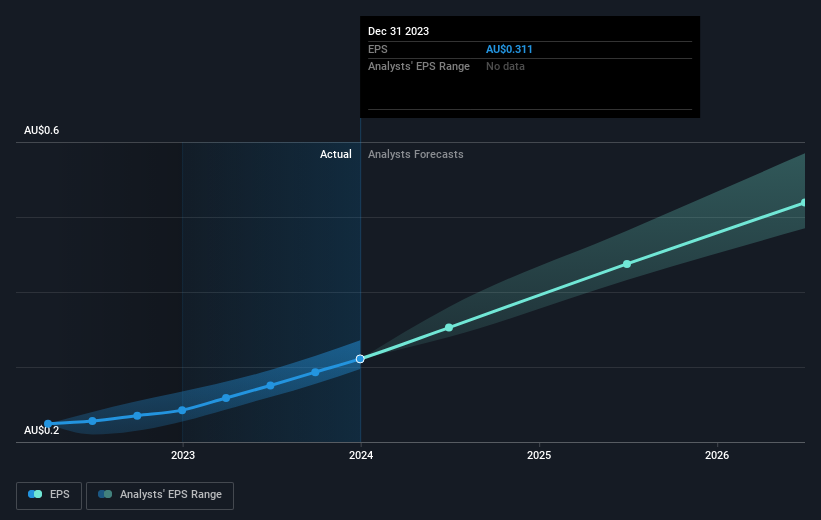
Over half a decade, Netwealth Group managed to grow its earnings per share at 20% a year. This EPS growth is higher than the 16% average annual increase in the share price. Therefore, it seems the market has become relatively pessimistic about the company. Of course, with a P/E ratio of 65.47, the market remains optimistic.
The image below shows how EPS has tracked over time (if you click on the image you can see greater detail).
We're pleased to report that the CEO is remunerated more modestly than most CEOs at similarly capitalized companies. It's always worth keeping an eye on CEO pay, but a more important question is whether the company will grow earnings throughout the years. Dive deeper into the earnings by checking this interactive graph of Netwealth Group's earnings, revenue and cash flow.
What About Dividends?
It is important to consider the total shareholder return, as well as the share price return, for any given stock. The TSR incorporates the value of any spin-offs or discounted capital raisings, along with any dividends, based on the assumption that the dividends are reinvested. It's fair to say that the TSR gives a more complete picture for stocks that pay a dividend. In the case of Netwealth Group, it has a TSR of 126% for the last 5 years. That exceeds its share price return that we previously mentioned. The dividends paid by the company have thusly boosted the total shareholder return.
A Different Perspective
It's nice to see that Netwealth Group shareholders have received a total shareholder return of 56% over the last year. Of course, that includes the dividend. Since the one-year TSR is better than the five-year TSR (the latter coming in at 18% per year), it would seem that the stock's performance has improved in recent times. In the best case scenario, this may hint at some real business momentum, implying that now could be a great time to delve deeper. I find it very interesting to look at share price over the long term as a proxy for business performance. But to truly gain insight, we need to consider other information, too. For example, we've discovered 1 warning sign for Netwealth Group that you should be aware of before investing here.
Of course, you might find a fantastic investment by looking elsewhere. So take a peek at this free list of companies we expect will grow earnings.
Please note, the market returns quoted in this article reflect the market weighted average returns of stocks that currently trade on Australian exchanges.
Have feedback on this article? Concerned about the content? Get in touch with us directly. Alternatively, email editorial-team (at) simplywallst.com.
This article by Simply Wall St is general in nature. We provide commentary based on historical data and analyst forecasts only using an unbiased methodology and our articles are not intended to be financial advice. It does not constitute a recommendation to buy or sell any stock, and does not take account of your objectives, or your financial situation. We aim to bring you long-term focused analysis driven by fundamental data. Note that our analysis may not factor in the latest price-sensitive company announcements or qualitative material. Simply Wall St has no position in any stocks mentioned.
