
 Yahoo Finance
 Is NEXT plc's (LON:NXT) P/E Ratio Really That Good?

Want to participate in a short research study? Help shape the future of investing tools and you could win a $250 gift card!
Today, we'll introduce the concept of the P/E ratio for those who are learning about investing. To keep it practical, we'll show how NEXT plc's (LON:NXT) P/E ratio could help you assess the value on offer. NEXT has a P/E ratio of 12.69, based on the last twelve months. That means that at current prices, buyers pay £12.69 for every £1 in trailing yearly profits.
Check out our latest analysis for NEXT
How Do You Calculate A P/E Ratio?
The formula for P/E is:
Price to Earnings Ratio = Price per Share ÷ Earnings per Share (EPS)
Or for NEXT:
P/E of 12.69 = £55.26 ÷ £4.35 (Based on the year to January 2019.)
Is A High P/E Ratio Good?
A higher P/E ratio implies that investors pay a higher price for the earning power of the business. All else being equal, it's better to pay a low price -- but as Warren Buffett said, 'It's far better to buy a wonderful company at a fair price than a fair company at a wonderful price.'
How Growth Rates Impact P/E Ratios
When earnings fall, the 'E' decreases, over time. That means unless the share price falls, the P/E will increase in a few years. Then, a higher P/E might scare off shareholders, pushing the share price down.
NEXT's earnings per share grew by -4.5% in the last twelve months. And it has bolstered its earnings per share by 3.5% per year over the last five years. In contrast, EPS has decreased by 1.1%, annually, over 3 years.
How Does NEXT's P/E Ratio Compare To Its Peers?
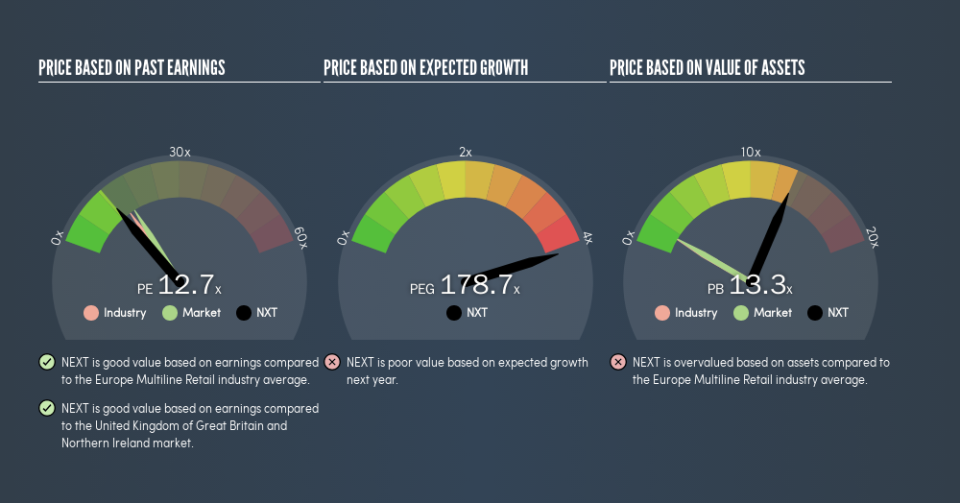
One good way to get a quick read on what market participants expect of a company is to look at its P/E ratio. We can see in the image below that the average P/E (14.7) for companies in the multiline retail industry is higher than NEXT's P/E.
NEXT's P/E tells us that market participants think it will not fare as well as its peers in the same industry. Since the market seems unimpressed with NEXT, it's quite possible it could surprise on the upside. You should delve deeper. I like to check if company insiders have been buying or selling.
A Limitation: P/E Ratios Ignore Debt and Cash In The Bank
The 'Price' in P/E reflects the market capitalization of the company. So it won't reflect the advantage of cash, or disadvantage of debt. Hypothetically, a company could reduce its future P/E ratio by spending its cash (or taking on debt) to achieve higher earnings.
While growth expenditure doesn't always pay off, the point is that it is a good option to have; but one that the P/E ratio ignores.
How Does NEXT's Debt Impact Its P/E Ratio?
NEXT has net debt worth 16% of its market capitalization. This could bring some additional risk, and reduce the number of investment options for management; worth remembering if you compare its P/E to businesses without debt.
The Bottom Line On NEXT's P/E Ratio
NEXT has a P/E of 12.7. That's below the average in the GB market, which is 16.3. EPS grew over the last twelve months, and debt levels are quite reasonable. The P/E ratio implies the market is cautious about longer term prospects.
Investors have an opportunity when market expectations about a stock are wrong. If it is underestimating a company, investors can make money by buying and holding the shares until the market corrects itself. So this free report on the analyst consensus forecasts could help you make a master move on this stock.
Of course you might be able to find a better stock than NEXT. So you may wish to see this free collection of other companies that have grown earnings strongly.
We aim to bring you long-term focused research analysis driven by fundamental data. Note that our analysis may not factor in the latest price-sensitive company announcements or qualitative material.
If you spot an error that warrants correction, please contact the editor at editorial-team@simplywallst.com. This article by Simply Wall St is general in nature. It does not constitute a recommendation to buy or sell any stock, and does not take account of your objectives, or your financial situation. Simply Wall St has no position in the stocks mentioned. Thank you for reading.
