Nikkei 225 Technical Analysis: 16,000 Handle in Sight
DailyFX.com -
Talking Points:
- Index approaching the 16,000 handle for possible resistance after finding support at 15,000
- A break above 16,000 might put the focus on 16,500 which proved influential in the past
- ATR readings at the highest levels since February
Volatility is set to remain high- learn good trading habits with the “Traits of Successful Traders” series
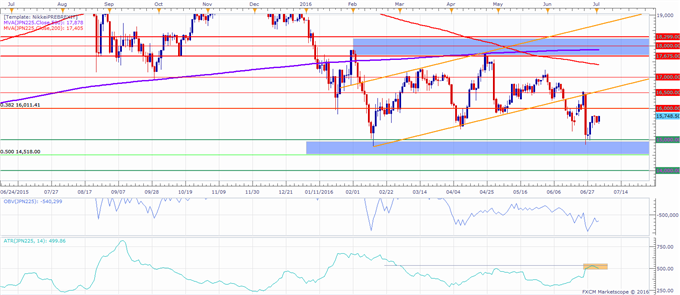
The Nikkei 225 is continuing its recovery after the “Brexit” decline, as the index edges closer to possible resistance at the 16,000 handle.
The index has bounced from an area of support between the 0.50 Fib at 14,518 (As was drawn for the last monthly leg higher from the June 2012 low at 8,190 to the June 2016 high at 20,961) and the 15,000 handle following the “Brexit” induced drop, which also sent volatility (as measured by the 14 day ATR) to the highest levels since February.
The move to the upside might put the focus on the 16,000 handle for possible resistance, and a break above that level may expose the 16,500 level, which seemed to be influential in the past for deciding short term directional conviction. The level also coincides with a broken channels trend line support turned resistance.
However, if the positive momentum proves only corrective, focus may be put again on the aforementioned support zone before further possible levels of support at the 14,000 handle and the 13,000 level, which coincides with the 0.618 Fib of the long term uptrend.
Nikkei 225 Daily Chart: July 4, 2016
--- Written by Oded Shimoni, Junior Currency Analyst for DailyFX.com
To contact Oded Shimoni, e-mail oshimoni@dailyfx.com
DailyFX provides forex news and technical analysis on the trends that influence the global currency markets.
Learn forex trading with a free practice account and trading charts from FXCM.

 Yahoo Finance

