
 Yahoo Finance
 NN Group NV's Dividend Analysis
Exploring the Sustainability and Growth of NN Group NV's Dividends
NN Group NV (NNGRY) recently announced a dividend of $1.11 per share, payable on 2024-07-05, with the ex-dividend date set for 2024-05-29. As investors look forward to this upcoming payment, the spotlight also shines on the company's dividend history, yield, and growth rates. Using data from GuruFocus, let's delve into NN Group NV's dividend performance and assess its sustainability.
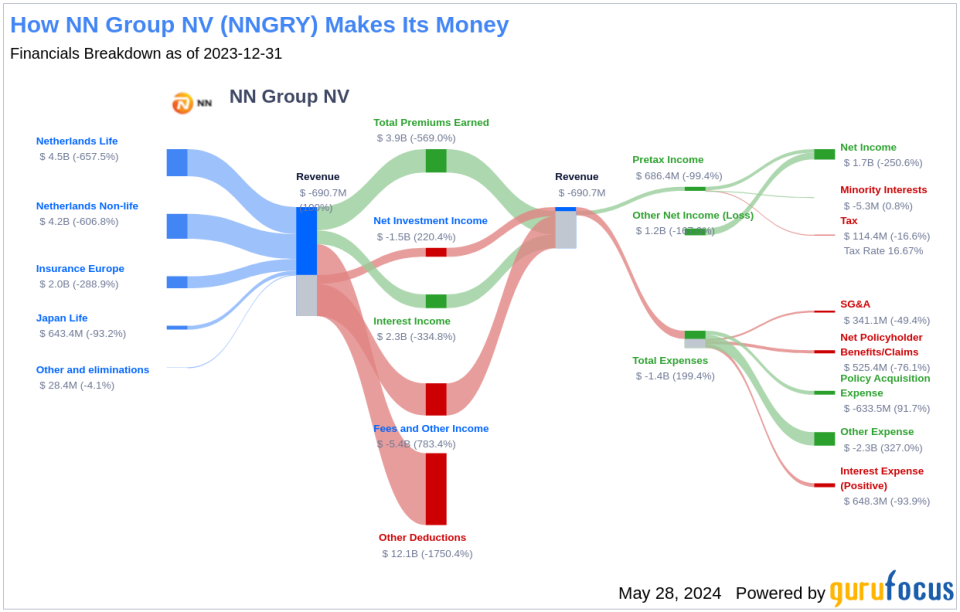
What Does NN Group NV Do?
This Powerful Chart Made Peter Lynch 29% A Year For 13 Years
How to calculate the intrinsic value of a stock?
NN Group NV, a European insurance giant, primarily operates in the Netherlands, offering long-term savings and insurance products. The company is segmented into four main divisions: Netherlands life, Netherlands nonlife, insurance Europe, and Japan life. The Netherlands life division, which accounts for about three-quarters of the operating income, focuses on both traditional spread-based and modern defined contribution savings products. Since 2022, assets supporting these products are managed by Goldman Sachs. Notably, since around 2013, NN Group NV has managed its individual life insurance business as closed to new business.
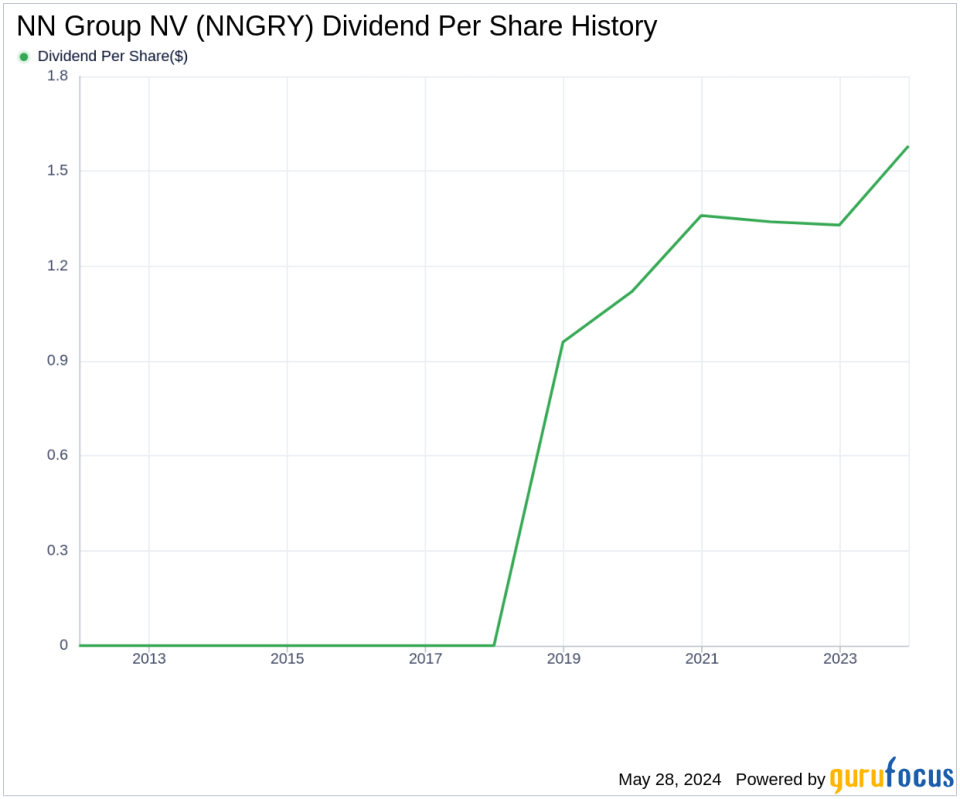
A Glimpse at NN Group NV's Dividend History
NN Group NV has maintained a consistent dividend payment record since 2018, distributing dividends bi-annually. Below is a chart showing annual Dividends Per Share for tracking historical trends.
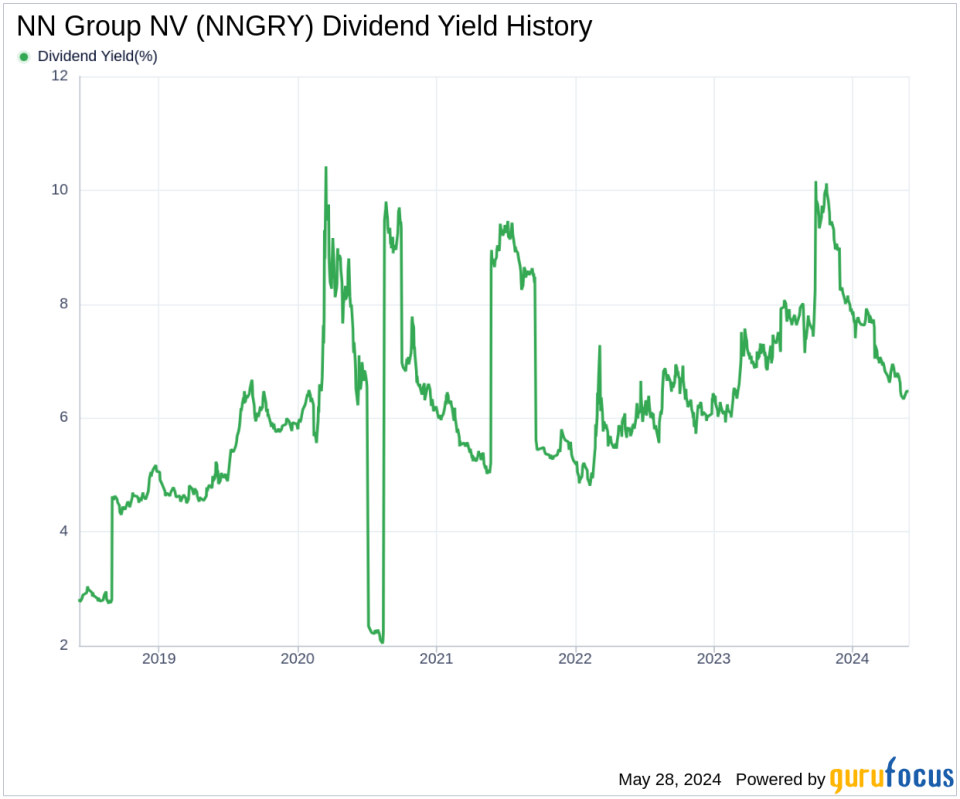
Breaking Down NN Group NV's Dividend Yield and Growth
Currently, NN Group NV boasts a 12-month trailing dividend yield of 6.47% and a forward dividend yield of 7.03%, indicating an expected increase in dividend payments over the next 12 months. Over the past three years, NN Group NV's annual dividend growth rate was 8.80%, which extended to 10.50% per year over a five-year horizon. Today, the 5-year yield on cost of NN Group NV stock is approximately 10.66%.
The Sustainability Question: Payout Ratio and Profitability
To assess the sustainability of the dividend, one needs to evaluate the company's payout ratio. The dividend payout ratio of 0.73 as of 2023-12-31 suggests that a significant part of earnings is distributed as dividends, which may raise concerns about sustainability. Furthermore, NN Group NV's profitability rank of 4 out of 10, combined with positive net income for the past decade, provides a nuanced view of its financial health.
Growth Metrics: The Future Outlook
The future sustainability of dividends heavily depends on a company's growth metrics. NN Group NV's growth rank of 4 out of 10, alongside its revenue and earnings performance, indicates challenges ahead. Specifically, the company's revenue per share and 3-year EPS growth rate have underperformed relative to global competitors, which could impact its ability to sustain dividend growth.
Conclusion: Evaluating NN Group NV's Dividend Strategy
While NN Group NV offers an attractive dividend yield and has shown commendable growth in its dividend distribution, the sustainability of these dividends is not without question. The company's payout ratio, mixed profitability metrics, and underwhelming growth indicators suggest that investors should proceed with caution. Those interested in high-dividend yield stocks might consider using the High Dividend Yield Screener available to GuruFocus Premium users for more insights.
This article, generated by GuruFocus, is designed to provide general insights and is not tailored financial advice. Our commentary is rooted in historical data and analyst projections, utilizing an impartial methodology, and is not intended to serve as specific investment guidance. It does not formulate a recommendation to purchase or divest any stock and does not consider individual investment objectives or financial circumstances. Our objective is to deliver long-term, fundamental data-driven analysis. Be aware that our analysis might not incorporate the most recent, price-sensitive company announcements or qualitative information. GuruFocus holds no position in the stocks mentioned herein.
This article first appeared on GuruFocus.
