
 Yahoo Finance
 Is Noble Energy, Inc.'s (NYSE:NBL) Balance Sheet A Threat To Its Future?
Want to participate in a short research study? Help shape the future of investing tools and you could win a $250 gift card!
Stocks with market capitalization between $2B and $10B, such as Noble Energy, Inc. (NYSE:NBL) with a size of US$9.8b, do not attract as much attention from the investing community as do the small-caps and large-caps. However, generally ignored mid-caps have historically delivered better risk-adjusted returns than the two other categories of stocks. Today we will look at NBL’s financial liquidity and debt levels, which are strong indicators for whether the company can weather economic downturns or fund strategic acquisitions for future growth. Note that this commentary is very high-level and solely focused on financial health, so I suggest you dig deeper yourself into NBL here.
See our latest analysis for Noble Energy
Does NBL Produce Much Cash Relative To Its Debt?
Over the past year, NBL has maintained its debt levels at around US$6.9b – this includes long-term debt. At this current level of debt, the current cash and short-term investment levels stands at US$528m , ready to be used for running the business. Additionally, NBL has generated US$2.3b in operating cash flow in the last twelve months, resulting in an operating cash to total debt ratio of 33%, indicating that NBL’s current level of operating cash is high enough to cover debt.
Can NBL pay its short-term liabilities?
Looking at NBL’s US$1.9b in current liabilities, the company may not be able to easily meet these obligations given the level of current assets of US$1.2b, with a current ratio of 0.64x. The current ratio is calculated by dividing current assets by current liabilities.
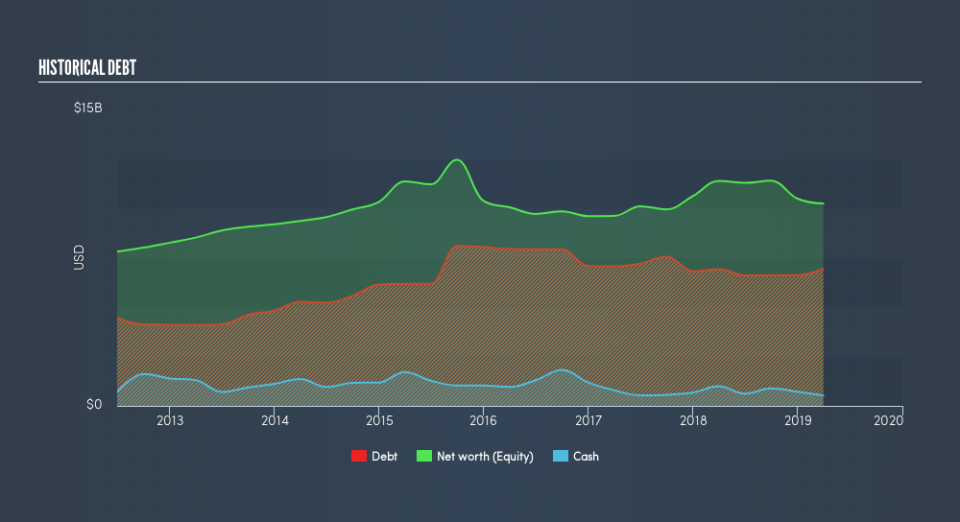
Is NBL’s debt level acceptable?
With debt reaching 66% of equity, NBL may be thought of as relatively highly levered. This is not uncommon for a mid-cap company given that debt tends to be lower-cost and at times, more accessible. But since NBL is currently loss-making, sustainability of its current state of operations becomes a concern. Running high debt, while not yet making money, can be risky in unexpected downturns as liquidity may dry up, making it hard to operate.
Next Steps:
NBL’s high cash coverage means that, although its debt levels are high, the company is able to utilise its borrowings efficiently in order to generate cash flow. Though its lack of liquidity raises questions over current asset management practices for the mid-cap. I admit this is a fairly basic analysis for NBL's financial health. Other important fundamentals need to be considered alongside. You should continue to research Noble Energy to get a more holistic view of the stock by looking at:
Future Outlook: What are well-informed industry analysts predicting for NBL’s future growth? Take a look at our free research report of analyst consensus for NBL’s outlook.
Valuation: What is NBL worth today? Is the stock undervalued, even when its growth outlook is factored into its intrinsic value? The intrinsic value infographic in our free research report helps visualize whether NBL is currently mispriced by the market.
Other High-Performing Stocks: Are there other stocks that provide better prospects with proven track records? Explore our free list of these great stocks here.
We aim to bring you long-term focused research analysis driven by fundamental data. Note that our analysis may not factor in the latest price-sensitive company announcements or qualitative material.
If you spot an error that warrants correction, please contact the editor at editorial-team@simplywallst.com. This article by Simply Wall St is general in nature. It does not constitute a recommendation to buy or sell any stock, and does not take account of your objectives, or your financial situation. Simply Wall St has no position in the stocks mentioned. Thank you for reading.
