
 Yahoo Finance
 Are Nokia Corporation’s (HEL:NOKIA) Interest Costs Too High?

Investors seeking to preserve capital in a volatile environment might consider large-cap stocks such as Nokia Corporation (HEL:NOKIA) a safer option. Doing business globally, large caps tend to have diversified revenue streams and attractive capital returns, making them desirable investments for risk-averse portfolios. But, the key to their continued success lies in its financial health. I will provide an overview of Nokia’s financial liquidity and leverage to give you an idea of Nokia’s position to take advantage of potential acquisitions or comfortably endure future downturns. Remember this is a very top-level look that focuses exclusively on financial health, so I recommend a deeper analysis into NOKIA here. Check out our latest analysis for Nokia
Does NOKIA produce enough cash relative to debt?
NOKIA’s debt level has been constant at around €3.91b over the previous year comprising of short- and long-term debt. At this constant level of debt, the current cash and short-term investment levels stands at €8.41b for investing into the business. On top of this, NOKIA has produced €1.81b in operating cash flow over the same time period, resulting in an operating cash to total debt ratio of 46.35%, indicating that NOKIA’s current level of operating cash is high enough to cover debt. This ratio can also be a sign of operational efficiency for unprofitable companies as traditional metrics such as return on asset (ROA) requires a positive net income. In NOKIA’s case, it is able to generate 0.46x cash from its debt capital.
Can NOKIA meet its short-term obligations with the cash in hand?
Looking at NOKIA’s most recent €12.74b liabilities, it seems that the business has been able to meet these commitments with a current assets level of €19.86b, leading to a 1.56x current account ratio. For Communications companies, this ratio is within a sensible range as there’s enough of a cash buffer without holding too capital in low return investments.
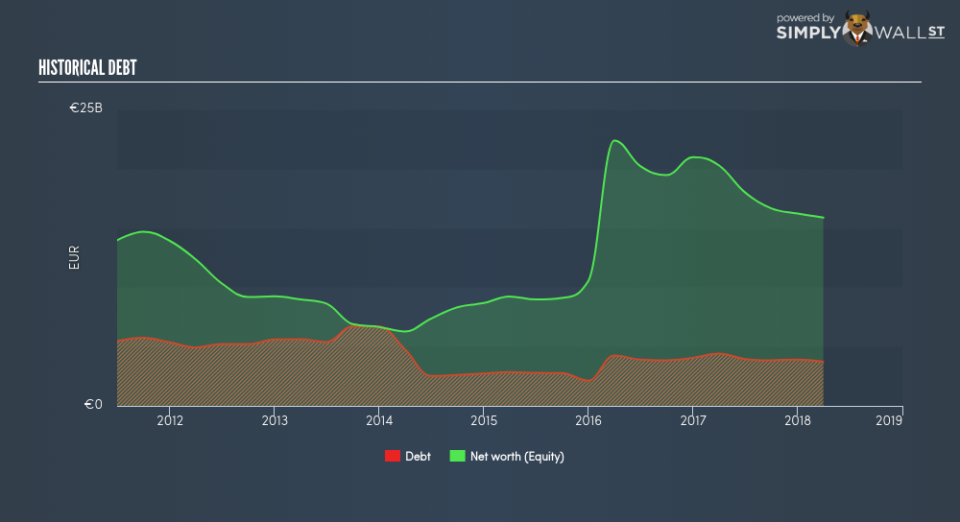
Can NOKIA service its debt comfortably?
With a debt-to-equity ratio of 23.44%, NOKIA’s debt level may be seen as prudent. This range is considered safe as NOKIA is not taking on too much debt obligation, which can be restrictive and risky for equity-holders. Risk around debt is very low for NOKIA, and the company also has the ability and headroom to increase debt if needed going forward.
Next Steps:
NOKIA’s high cash coverage and appropriate debt levels indicate its ability to utilise its borrowings efficiently in order to generate ample cash flow. In addition to this, the company exhibits proper management of current assets and upcoming liabilities. I admit this is a fairly basic analysis for NOKIA’s financial health. Other important fundamentals need to be considered alongside. I suggest you continue to research Nokia to get a better picture of the stock by looking at:
Future Outlook: What are well-informed industry analysts predicting for NOKIA’s future growth? Take a look at our free research report of analyst consensus for NOKIA’s outlook.
Valuation: What is NOKIA worth today? Is the stock undervalued, even when its growth outlook is factored into its intrinsic value? The intrinsic value infographic in our free research report helps visualize whether NOKIA is currently mispriced by the market.
Other High-Performing Stocks: Are there other stocks that provide better prospects with proven track records? Explore our free list of these great stocks here.
To help readers see pass the short term volatility of the financial market, we aim to bring you a long-term focused research analysis purely driven by fundamental data. Note that our analysis does not factor in the latest price sensitive company announcements.
The author is an independent contributor and at the time of publication had no position in the stocks mentioned.
