
 Yahoo Finance
 What Can We Make Of Nokian Renkaat Oyj’s (HEL:TYRES) High Return On Capital?

Want to participate in a short research study? Help shape the future of investing tools and you could win a $250 gift card!
Today we are going to look at Nokian Renkaat Oyj (HEL:TYRES) to see whether it might be an attractive investment prospect. Specifically, we're going to calculate its Return On Capital Employed (ROCE), in the hopes of getting some insight into the business.
Firstly, we'll go over how we calculate ROCE. Then we'll compare its ROCE to similar companies. And finally, we'll look at how its current liabilities are impacting its ROCE.
Return On Capital Employed (ROCE): What is it?
ROCE measures the 'return' (pre-tax profit) a company generates from capital employed in its business. Generally speaking a higher ROCE is better. Overall, it is a valuable metric that has its flaws. Renowned investment researcher Michael Mauboussin has suggested that a high ROCE can indicate that 'one dollar invested in the company generates value of more than one dollar'.
So, How Do We Calculate ROCE?
The formula for calculating the return on capital employed is:
Return on Capital Employed = Earnings Before Interest and Tax (EBIT) ÷ (Total Assets - Current Liabilities)
Or for Nokian Renkaat Oyj:
0.19 = €367m ÷ (€2.3b - €397m) (Based on the trailing twelve months to March 2019.)
So, Nokian Renkaat Oyj has an ROCE of 19%.
View our latest analysis for Nokian Renkaat Oyj
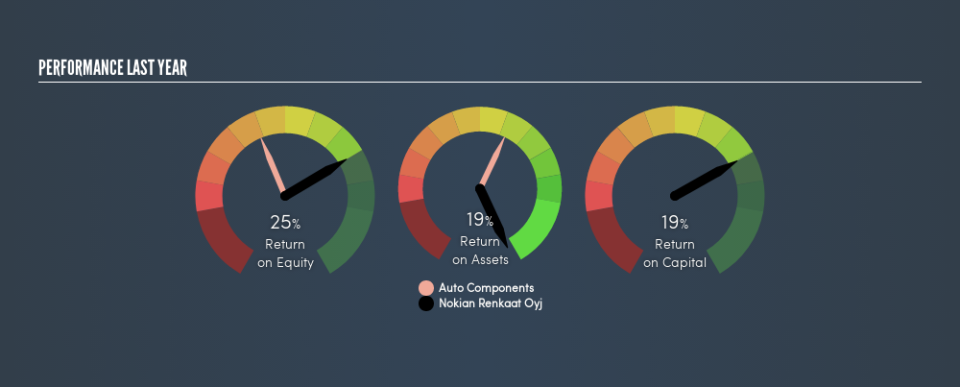
Does Nokian Renkaat Oyj Have A Good ROCE?
ROCE is commonly used for comparing the performance of similar businesses. Nokian Renkaat Oyj's ROCE appears to be substantially greater than the 10% average in the Auto Components industry. I think that's good to see, since it implies the company is better than other companies at making the most of its capital. Setting aside the comparison to its industry for a moment, Nokian Renkaat Oyj's ROCE in absolute terms currently looks quite high.
The image below shows how Nokian Renkaat Oyj's ROCE compares to its industry, and you can click it to see more detail on its past growth.
When considering ROCE, bear in mind that it reflects the past and does not necessarily predict the future. ROCE can be deceptive for cyclical businesses, as returns can look incredible in boom times, and terribly low in downturns. This is because ROCE only looks at one year, instead of considering returns across a whole cycle. Since the future is so important for investors, you should check out our free report on analyst forecasts for Nokian Renkaat Oyj.
Nokian Renkaat Oyj's Current Liabilities And Their Impact On Its ROCE
Short term (or current) liabilities, are things like supplier invoices, overdrafts, or tax bills that need to be paid within 12 months. The ROCE equation subtracts current liabilities from capital employed, so a company with a lot of current liabilities appears to have less capital employed, and a higher ROCE than otherwise. To counter this, investors can check if a company has high current liabilities relative to total assets.
Nokian Renkaat Oyj has total assets of €2.3b and current liabilities of €397m. Therefore its current liabilities are equivalent to approximately 17% of its total assets. The fairly low level of current liabilities won't have much impact on the already great ROCE.
The Bottom Line On Nokian Renkaat Oyj's ROCE
Low current liabilities and high ROCE is a good combination, making Nokian Renkaat Oyj look quite interesting. Nokian Renkaat Oyj looks strong on this analysis, but there are plenty of other companies that could be a good opportunity . Here is a free list of companies growing earnings rapidly.
If you are like me, then you will not want to miss this free list of growing companies that insiders are buying.
We aim to bring you long-term focused research analysis driven by fundamental data. Note that our analysis may not factor in the latest price-sensitive company announcements or qualitative material.
If you spot an error that warrants correction, please contact the editor at editorial-team@simplywallst.com. This article by Simply Wall St is general in nature. It does not constitute a recommendation to buy or sell any stock, and does not take account of your objectives, or your financial situation. Simply Wall St has no position in the stocks mentioned. Thank you for reading.
