
 Yahoo Finance
 Nordic American Tankers Limited's (NYSE:NAT) Business Is Trailing The Industry But Its Shares Aren't
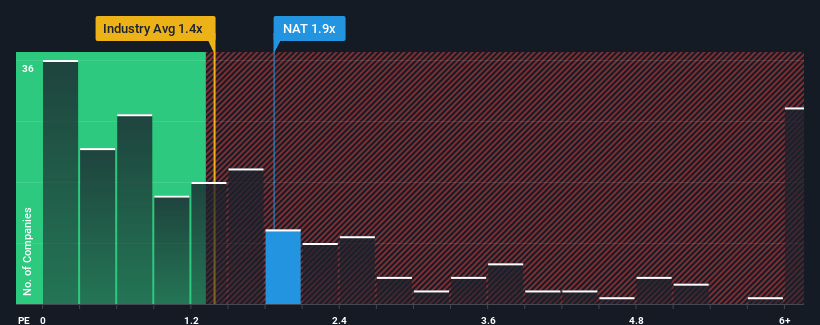
With a median price-to-sales (or "P/S") ratio of close to 1.4x in the Oil and Gas industry in the United States, you could be forgiven for feeling indifferent about Nordic American Tankers Limited's (NYSE:NAT) P/S ratio of 1.9x. Although, it's not wise to simply ignore the P/S without explanation as investors may be disregarding a distinct opportunity or a costly mistake.
View our latest analysis for Nordic American Tankers
What Does Nordic American Tankers' Recent Performance Look Like?
Recent times have been advantageous for Nordic American Tankers as its revenues have been rising faster than most other companies. One possibility is that the P/S ratio is moderate because investors think this strong revenue performance might be about to tail off. If not, then existing shareholders have reason to be feeling optimistic about the future direction of the share price.
If you'd like to see what analysts are forecasting going forward, you should check out our free report on Nordic American Tankers.
What Are Revenue Growth Metrics Telling Us About The P/S?
In order to justify its P/S ratio, Nordic American Tankers would need to produce growth that's similar to the industry.
Retrospectively, the last year delivered an exceptional 119% gain to the company's top line. The latest three year period has also seen a 17% overall rise in revenue, aided extensively by its short-term performance. Accordingly, shareholders would have probably been satisfied with the medium-term rates of revenue growth.
Shifting to the future, estimates from the three analysts covering the company are not good at all, suggesting revenue should decline by 29% over the next year. With the rest of the industry predicted to shrink by 9.8%, it's a sub-optimal result.
With this in mind, we find it intriguing that Nordic American Tankers' P/S is similar to its industry peers. With revenue going quickly in reverse, it's not guaranteed that the P/S has found a floor yet. Maintaining these prices will be difficult to achieve as the weak outlook is likely to weigh down the shares eventually.
The Bottom Line On Nordic American Tankers' P/S
Using the price-to-sales ratio alone to determine if you should sell your stock isn't sensible, however it can be a practical guide to the company's future prospects.
Nordic American Tankers currently trades on a higher P/S than expected based on revenue decline, even more so since its revenue forecast is even worse than the struggling industry. It's not unusual in cases where revenue growth is poor, that the share price declines, sending the moderate P/S lower relative to the industry. In addition, we would be concerned whether the company can even maintain this level of performance under these tough industry conditions. A positive change is needed in order to justify the current price-to-sales ratio.
It is also worth noting that we have found 3 warning signs for Nordic American Tankers that you need to take into consideration.
If companies with solid past earnings growth is up your alley, you may wish to see this free collection of other companies with strong earnings growth and low P/E ratios.
Have feedback on this article? Concerned about the content? Get in touch with us directly. Alternatively, email editorial-team (at) simplywallst.com.
This article by Simply Wall St is general in nature. We provide commentary based on historical data and analyst forecasts only using an unbiased methodology and our articles are not intended to be financial advice. It does not constitute a recommendation to buy or sell any stock, and does not take account of your objectives, or your financial situation. We aim to bring you long-term focused analysis driven by fundamental data. Note that our analysis may not factor in the latest price-sensitive company announcements or qualitative material. Simply Wall St has no position in any stocks mentioned.
Join A Paid User Research Session
You’ll receive a US$30 Amazon Gift card for 1 hour of your time while helping us build better investing tools for the individual investors like yourself. Sign up here
