
 Yahoo Finance
 Is Norman Broadbent Plc's (LON:NBB) CEO Paid At A Competitive Rate?

Mike Brennan became the CEO of Norman Broadbent Plc (LON:NBB) in 2016. This analysis aims first to contrast CEO compensation with other companies that have similar market capitalization. Then we'll look at a snap shot of the business growth. And finally we will reflect on how common stockholders have fared in the last few years, as a secondary measure of performance. The aim of all this is to consider the appropriateness of CEO pay levels.
See our latest analysis for Norman Broadbent
How Does Mike Brennan's Compensation Compare With Similar Sized Companies?
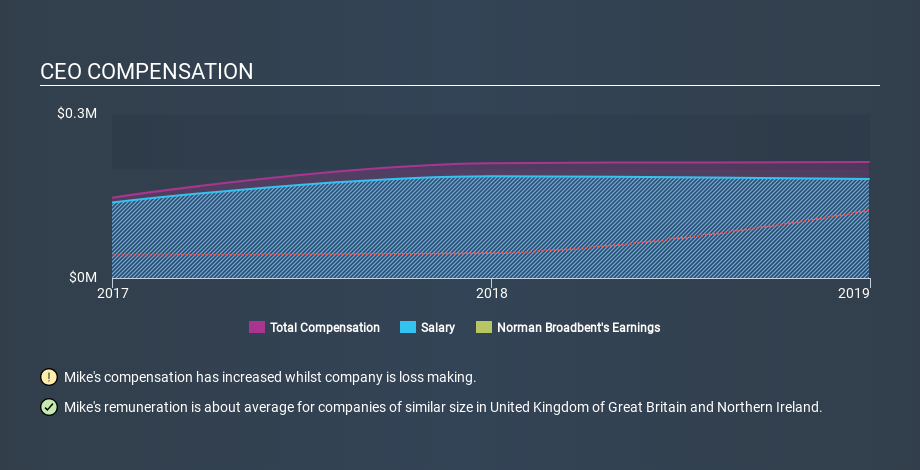
According to our data, Norman Broadbent Plc has a market capitalization of UK£4.0m, and paid its CEO total annual compensation worth UK£212k over the year to December 2018. While we always look at total compensation first, we note that the salary component is less, at UK£181k. We examined a group of similar sized companies, with market capitalizations of below UK£154m. The median CEO total compensation in that group is UK£250k.
So Mike Brennan receives a similar amount to the median CEO pay, amongst the companies we looked at. Although this fact alone doesn't tell us a great deal, it becomes more relevant when considered against the business performance.
You can see a visual representation of the CEO compensation at Norman Broadbent, below.
Is Norman Broadbent Plc Growing?
On average over the last three years, Norman Broadbent Plc has grown earnings per share (EPS) by 43% each year (using a line of best fit). It achieved revenue growth of 27% over the last year.
This demonstrates that the company has been improving recently. A good result. The combination of strong revenue growth with medium-term earnings per share improvement certainly points to the kind of growth I like to see. Although we don't have analyst forecasts you could get a better understanding of its growth by checking out this more detailed historical graph of earnings, revenue and cash flow.
Has Norman Broadbent Plc Been A Good Investment?
Since shareholders would have lost about 25% over three years, some Norman Broadbent Plc shareholders would surely be feeling negative emotions. This suggests it would be unwise for the company to pay the CEO too generously.
In Summary...
Mike Brennan is paid around what is normal the leaders of comparable size companies.
We'd say the company can boast of its EPS growth, but we find the returns over the last three years to be lacking. We'd be surprised if shareholders want to see a pay rise for the CEO, but we'd stop short of calling their pay too generous. Shareholders may want to check for free if Norman Broadbent insiders are buying or selling shares.
If you want to buy a stock that is better than Norman Broadbent, this free list of high return, low debt companies is a great place to look.
If you spot an error that warrants correction, please contact the editor at editorial-team@simplywallst.com. This article by Simply Wall St is general in nature. It does not constitute a recommendation to buy or sell any stock, and does not take account of your objectives, or your financial situation. Simply Wall St has no position in the stocks mentioned.
We aim to bring you long-term focused research analysis driven by fundamental data. Note that our analysis may not factor in the latest price-sensitive company announcements or qualitative material. Thank you for reading.
