
 Yahoo Finance
 Northamber (LON:NAR) Might Have The Makings Of A Multi-Bagger
What trends should we look for it we want to identify stocks that can multiply in value over the long term? Amongst other things, we'll want to see two things; firstly, a growing return on capital employed (ROCE) and secondly, an expansion in the company's amount of capital employed. This shows us that it's a compounding machine, able to continually reinvest its earnings back into the business and generate higher returns. Speaking of which, we noticed some great changes in Northamber's (LON:NAR) returns on capital, so let's have a look.
Understanding Return On Capital Employed (ROCE)
If you haven't worked with ROCE before, it measures the 'return' (pre-tax profit) a company generates from capital employed in its business. To calculate this metric for Northamber, this is the formula:
Return on Capital Employed = Earnings Before Interest and Tax (EBIT) ÷ (Total Assets - Current Liabilities)
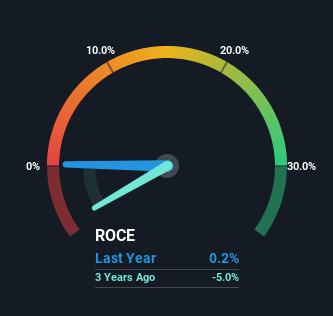
0.0015 = UK£38k ÷ (UK£34m - UK£8.9m) (Based on the trailing twelve months to December 2021).
Therefore, Northamber has an ROCE of 0.2%. Ultimately, that's a low return and it under-performs the Electronic industry average of 12%.
See our latest analysis for Northamber
While the past is not representative of the future, it can be helpful to know how a company has performed historically, which is why we have this chart above. If you'd like to look at how Northamber has performed in the past in other metrics, you can view this free graph of past earnings, revenue and cash flow.
How Are Returns Trending?
Northamber has recently broken into profitability so their prior investments seem to be paying off. Shareholders would no doubt be pleased with this because the business was loss-making five years ago but is is now generating 0.2% on its capital. And unsurprisingly, like most companies trying to break into the black, Northamber is utilizing 34% more capital than it was five years ago. This can tell us that the company has plenty of reinvestment opportunities that are able to generate higher returns.
Our Take On Northamber's ROCE
Long story short, we're delighted to see that Northamber's reinvestment activities have paid off and the company is now profitable. Since the stock has returned a solid 69% to shareholders over the last five years, it's fair to say investors are beginning to recognize these changes. Therefore, we think it would be worth your time to check if these trends are going to continue.
On a separate note, we've found 1 warning sign for Northamber you'll probably want to know about.
If you want to search for solid companies with great earnings, check out this free list of companies with good balance sheets and impressive returns on equity.
Have feedback on this article? Concerned about the content? Get in touch with us directly. Alternatively, email editorial-team (at) simplywallst.com.
This article by Simply Wall St is general in nature. We provide commentary based on historical data and analyst forecasts only using an unbiased methodology and our articles are not intended to be financial advice. It does not constitute a recommendation to buy or sell any stock, and does not take account of your objectives, or your financial situation. We aim to bring you long-term focused analysis driven by fundamental data. Note that our analysis may not factor in the latest price-sensitive company announcements or qualitative material. Simply Wall St has no position in any stocks mentioned.
