
 Yahoo Finance
 Northgate: a cyclical recovery play?
In his bestselling book, One Up on Wall Street, Peter Lynch warned that ‘you can lose more than fifty percent of your investments if you buy cyclicals in the wrong part of the cycle.’ This was the sad lesson learned by Northgate’s shareholders during the crash of 2008. The earnings and prices of cyclical stocks usually rise and fall as the economy expands and contracts. Northgate operates in the highly cyclical vehicle hire business and saw its share price collapse by around 90% in 2008. However, the economy is improving and Northgate’s share price has risen by 10% over the last year while the FTSE 100 has been flat. So let’s explore whether Northgate has what it takes to be a solid cyclical recovery play.
Decline and fall
Prior to the 2008 recession, Northgate, a £700m Market Cap FTSE 350 constituent, had enjoyed a nine year period of consecutive growth in sales and earnings. By the end of 2008, the company had grown its fleet to 68,600 vehicles in the UK and 62,750 in Spain. However, it was badly hit by the recession. The company’s markets started to deteriorate in 2008, as the company suffered from a reduction in demand, a lack of available credit for vehicle purchasers, and a consequent fall in vehicle hires. Indeed, Northgate’s annual report for 2009 noted a 6% reduction in the number of vehicles on rent, as customers downsized their vehicle fleets. The company was forced to dispose of 23,400 vehicles during the year (down from 26,800 in 2008), whilst restricting purchases of new vehicles to only 16,900 (down from 28,500 in 2008).
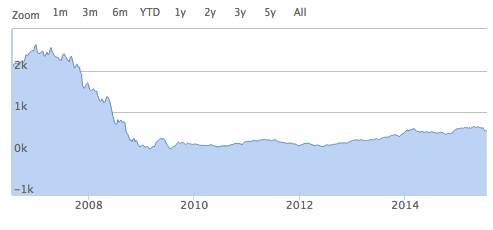
Things got so bad that the company issued two profit warnings - one in December 2008 and another in February 2009 - before finally reporting it had suffered a loss per share of 263.2p. Profits before tax decreased by 67% to £27.5m. Pressure on the company’s finances became so great that Northgate was forced to raise funds from shareholders. Indeed, in July 2009, the company announced a fully underwritten placing and rights issue to raise GBP 114.4 million (GBP 108.0 million net of expenses). The chart below illustrates how the market reacted to these developments:
On the rise?
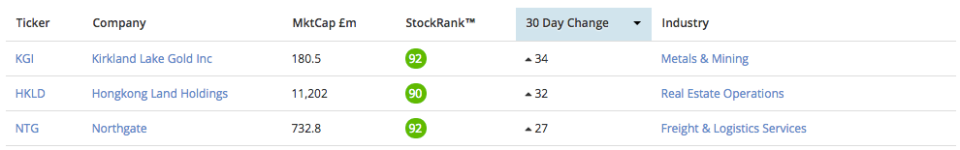
Earnings continued to fall in 2010 and 2011, but have increased over the last two years, against the backdrop of the wider economic recovery. Northgate’s latest annual report (for the year ending April 2015) boasted ‘strong results’ and ‘continued growth in both the UK and Spain.’ It was these strong results, released on 30 June, which helped drive the company’s StockRank higher. The StockRank Movers page shows that the StockRank has moved by 27 over the last 30 days.

As Northgate recovers from the 2008 recession, the company is becoming increasingly exposed to factors which have historically driven share price returns - namely, value, quality and momentum.
The Piotroski F-Score is one of the most useful metrics to assess whether a stock has improving fundamentals. It is an important component of Stockopedia’s QualityRank. The Score seeks to identify companies that are profit-making, have improving margins, don’t employ any accounting tricks and have strengthening balance sheets. Before Northgate published annual results on 30 June, it had a F-Score of 5 out of 9. The company now has an F-Score of 7 out of 9, as gross profit margins are higher than they were last year, and Northgate’s capacity to service long-term debt is improving. The company has an overall QualityRank of 86 and a ValueRank of 60, while the blended StockRank is currently 92.
Jim Slater is an investment legend who targeted growth stocks at reasonable prices, and in his famous book the Zulu Principle, he identified cyclical stocks as an area of particular interest. Indeed, he outlined several criteria that cyclical stocks must meet. Some of these criteria are qualitative, some are quantitative. Does Northgate meet these criteria?
According to Peter Lynch, the charts of cyclical stocks look like ‘maps of the Alps.’ The share price ‘drops’ down one mountain before ‘climbing’ back up the next mountain. The chart of Northgate shows a drop, but there is no rise of similar magnitude. The company’s fundamentals have improved, but the share price and PE ratio are still well below their pre-recession peaks. Are we still in the foothills of a larger climb? Please feel free to leave your own opinions below...
Read More about Northgate on Stockopedia
Discuss Northgate on Stockopedia
