
 Yahoo Finance
 Should You Have Nostrum Oil & Gas PLC’s (LON:NOG) In Your Portfolio?

Anyone researching Nostrum Oil & Gas PLC (LON:NOG) might want to consider the historical volatility of the share price. Modern finance theory considers volatility to be a measure of risk, and there are two main types of price volatility. First, we have company specific volatility, which is the price gyrations of an individual stock. Holding at least 8 stocks can reduce this kind of risk across a portfolio. The other type, which cannot be diversified away, is the volatility of the entire market. Every stock in the market is exposed to this volatility, which is linked to the fact that stocks prices are correlated in an efficient market.
Some stocks mimic the volatility of the market quite closely, while others demonstrate muted, exagerrated or uncorrelated price movements. Some investors use beta as a measure of how much a certain stock is impacted by market risk (volatility). While we should keep in mind that Warren Buffett has cautioned that ‘Volatility is far from synonymous with risk’, beta is still a useful factor to consider. To make good use of it you must first know that the beta of the overall market is one. A stock with a beta below one is either less volatile than the market, or more volatile but not corellated with the overall market. In comparison a stock with a beta of over one tends to be move in a similar direction to the market in the long term, but with greater changes in price.
See our latest analysis for Nostrum Oil & Gas
What we can learn from NOG’s beta value
With a beta of 0.92, (which is quite close to 1) the share price of Nostrum Oil & Gas has historically been about as voltile as the broader market. While history does not always repeat, this may indicate that the stock price will continue to be exposed to market risk, albeit not overly so. Many would argue that beta is useful in position sizing, but fundamental metrics such as revenue and earnings are more important overall. You can see Nostrum Oil & Gas’s revenue and earnings in the image below.
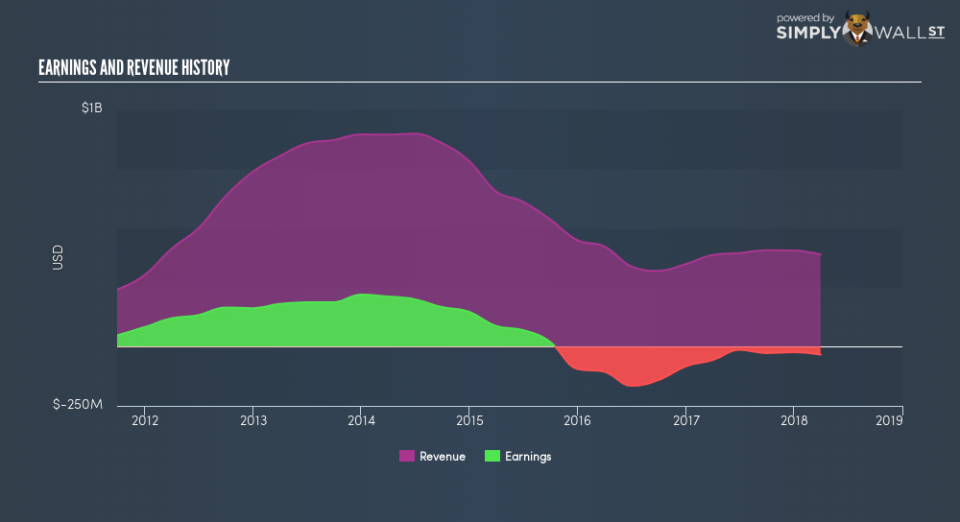
Could NOG’s size cause it to be more volatile?
Nostrum Oil & Gas is a small cap stock with a market capitalisation of US$450.12m. Most companies this size are actively traded. Small companies often have a high beta value because the stock price can move on relatively low capital flows. So it’s interesting to note that this stock historically has a beta value quite close to one.
What this means for you:
It is probable that there is a link between the share price of Nostrum Oil & Gas and the broader market, since it has a beta value quite close to one. However, long term investors are generally well served by looking past market volatility and focussing on the underlying development of the business. If that’s your game, metrics such as revenue, earnings and cash flow will be more useful. This article aims to educate investors about beta values, but it’s well worth looking at important company-specific fundamentals such as Nostrum Oil & Gas’s financial health and performance track record. I highly recommend you dive deeper by considering the following:
Future Outlook: What are well-informed industry analysts predicting for NOG’s future growth? Take a look at our free research report of analyst consensus for NOG’s outlook.
Past Track Record: Has NOG been consistently performing well irrespective of the ups and downs in the market? Go into more detail in the past performance analysis and take a look at the free visual representations of NOG’s historicals for more clarity.
Other Interesting Stocks: It’s worth checking to see how NOG measures up against other companies on valuation. You could start with this free list of prospective options.
To help readers see past the short term volatility of the financial market, we aim to bring you a long-term focused research analysis purely driven by fundamental data. Note that our analysis does not factor in the latest price-sensitive company announcements.
The author is an independent contributor and at the time of publication had no position in the stocks mentioned. For errors that warrant correction please contact the editor at editorial-team@simplywallst.com.
