
 Yahoo Finance
 Not Many Are Piling Into Comptoir Group PLC (LON:COM) Just Yet
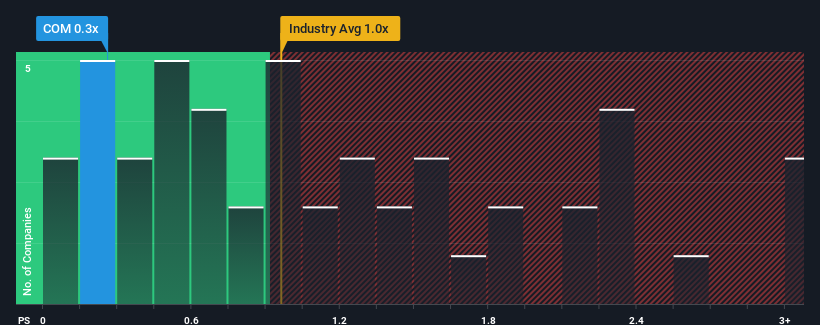
When close to half the companies operating in the Hospitality industry in the United Kingdom have price-to-sales ratios (or "P/S") above 1x, you may consider Comptoir Group PLC (LON:COM) as an attractive investment with its 0.3x P/S ratio. However, the P/S might be low for a reason and it requires further investigation to determine if it's justified.
View our latest analysis for Comptoir Group
What Does Comptoir Group's P/S Mean For Shareholders?
Comptoir Group has been doing a decent job lately as it's been growing revenue at a reasonable pace. Perhaps the market believes the recent revenue performance might fall short of industry figures in the near future, leading to a reduced P/S. If you like the company, you'd be hoping this isn't the case so that you could potentially pick up some stock while it's out of favour.
Although there are no analyst estimates available for Comptoir Group, take a look at this free data-rich visualisation to see how the company stacks up on earnings, revenue and cash flow.
How Is Comptoir Group's Revenue Growth Trending?
In order to justify its P/S ratio, Comptoir Group would need to produce sluggish growth that's trailing the industry.
If we review the last year of revenue growth, the company posted a worthy increase of 6.0%. This was backed up an excellent period prior to see revenue up by 32% in total over the last three years. Accordingly, shareholders would have definitely welcomed those medium-term rates of revenue growth.
Weighing that recent medium-term revenue trajectory against the broader industry's one-year forecast for expansion of 8.1% shows it's about the same on an annualised basis.
In light of this, it's peculiar that Comptoir Group's P/S sits below the majority of other companies. Apparently some shareholders are more bearish than recent times would indicate and have been accepting lower selling prices.
The Bottom Line On Comptoir Group's P/S
It's argued the price-to-sales ratio is an inferior measure of value within certain industries, but it can be a powerful business sentiment indicator.
Our examination of Comptoir Group revealed its three-year revenue trends looking similar to current industry expectations hasn't given the P/S the boost we expected, given that it's lower than the wider industry P/S, There could be some unobserved threats to revenue preventing the P/S ratio from matching the company's performance. At least the risk of a price drop looks to be subdued if recent medium-term revenue trends continue, but investors seem to think future revenue could see some volatility.
There are also other vital risk factors to consider before investing and we've discovered 1 warning sign for Comptoir Group that you should be aware of.
It's important to make sure you look for a great company, not just the first idea you come across. So if growing profitability aligns with your idea of a great company, take a peek at this free list of interesting companies with strong recent earnings growth (and a low P/E).
Have feedback on this article? Concerned about the content? Get in touch with us directly. Alternatively, email editorial-team (at) simplywallst.com.
This article by Simply Wall St is general in nature. We provide commentary based on historical data and analyst forecasts only using an unbiased methodology and our articles are not intended to be financial advice. It does not constitute a recommendation to buy or sell any stock, and does not take account of your objectives, or your financial situation. We aim to bring you long-term focused analysis driven by fundamental data. Note that our analysis may not factor in the latest price-sensitive company announcements or qualitative material. Simply Wall St has no position in any stocks mentioned.
