
 Yahoo Finance
 Not Many Are Piling Into Textainer Group Holdings Limited (NYSE:TGH) Just Yet

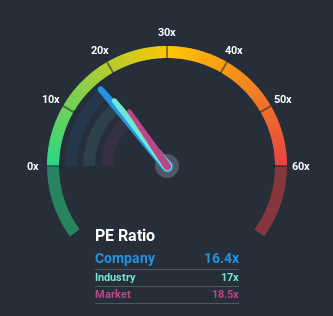
With a price-to-earnings (or "P/E") ratio of 16.4x Textainer Group Holdings Limited (NYSE:TGH) may be sending bullish signals at the moment, given that almost half of all companies in the United States have P/E ratios greater than 19x and even P/E's higher than 37x are not unusual. Nonetheless, we'd need to dig a little deeper to determine if there is a rational basis for the reduced P/E.
Textainer Group Holdings certainly has been doing a good job lately as its earnings growth has been positive while most other companies have been seeing their earnings go backwards. It might be that many expect the strong earnings performance to degrade substantially, possibly more than the market, which has repressed the P/E. If not, then existing shareholders have reason to be quite optimistic about the future direction of the share price.
View our latest analysis for Textainer Group Holdings
If you'd like to see what analysts are forecasting going forward, you should check out our free report on Textainer Group Holdings.
What Are Growth Metrics Telling Us About The Low P/E?
The only time you'd be truly comfortable seeing a P/E as low as Textainer Group Holdings' is when the company's growth is on track to lag the market.
Retrospectively, the last year delivered an exceptional 65% gain to the company's bottom line. Although, its longer-term performance hasn't been as strong with three-year EPS growth being relatively non-existent overall. Therefore, it's fair to say that earnings growth has been inconsistent recently for the company.
Shifting to the future, estimates from the lone analyst covering the company suggest earnings should grow by 18% per annum over the next three years. With the market only predicted to deliver 13% per annum, the company is positioned for a stronger earnings result.
With this information, we find it odd that Textainer Group Holdings is trading at a P/E lower than the market. Apparently some shareholders are doubtful of the forecasts and have been accepting significantly lower selling prices.
What We Can Learn From Textainer Group Holdings' P/E?
It's argued the price-to-earnings ratio is an inferior measure of value within certain industries, but it can be a powerful business sentiment indicator.
Our examination of Textainer Group Holdings' analyst forecasts revealed that its superior earnings outlook isn't contributing to its P/E anywhere near as much as we would have predicted. When we see a strong earnings outlook with faster-than-market growth, we assume potential risks are what might be placing significant pressure on the P/E ratio. It appears many are indeed anticipating earnings instability, because these conditions should normally provide a boost to the share price.
And what about other risks? Every company has them, and we've spotted 3 warning signs for Textainer Group Holdings (of which 1 can't be ignored!) you should know about.
Of course, you might find a fantastic investment by looking at a few good candidates. So take a peek at this free list of companies with a strong growth track record, trading on a P/E below 20x.
This article by Simply Wall St is general in nature. It does not constitute a recommendation to buy or sell any stock, and does not take account of your objectives, or your financial situation. We aim to bring you long-term focused analysis driven by fundamental data. Note that our analysis may not factor in the latest price-sensitive company announcements or qualitative material. Simply Wall St has no position in any stocks mentioned.
Have feedback on this article? Concerned about the content? Get in touch with us directly. Alternatively, email editorial-team@simplywallst.com.
