
 Yahoo Finance
 Would Novo Nordisk A/S (CPH:NOVO B) Be Valuable To Income Investors?

Want to participate in a short research study? Help shape the future of investing tools and you could win a $250 gift card!
Dividend paying stocks like Novo Nordisk A/S (CPH:NOVO B) tend to be popular with investors, and for good reason - some research suggests a significant amount of all stock market returns come from reinvested dividends. If you are hoping to live on your dividends, it's important to be more stringent with your investments than the average punter. Regular readers know we like to apply the same approach to each dividend stock, and we hope you'll find our analysis useful.
A slim 2.4% yield is hard to get excited about, but the long payment history is respectable. At the right price, or with strong growth opportunities, Novo Nordisk could have potential. The company also bought back stock equivalent to around 1.8% of market capitalisation this year. Some simple research can reduce the risk of buying Novo Nordisk for its dividend - read on to learn more.
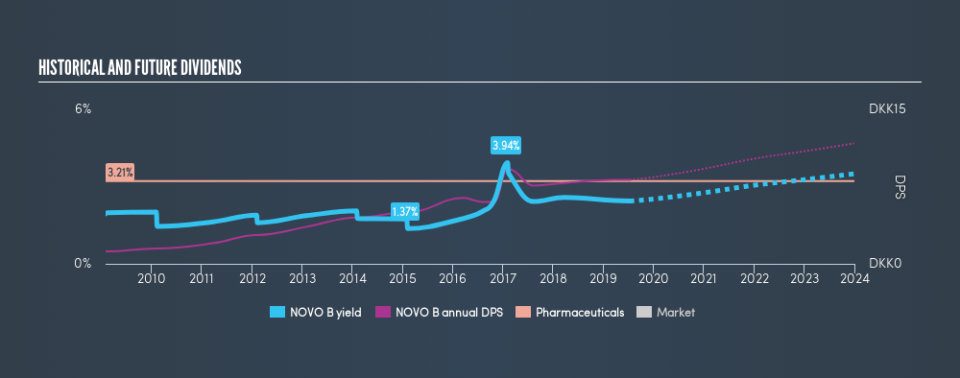
Click the interactive chart for our full dividend analysis
Payout ratios
Companies (usually) pay dividends out of their earnings. If a company is paying more than it earns, the dividend might have to be cut. As a result, we should always investigate whether a company can afford its dividend, measured as a percentage of a company's net income after tax. Looking at the data, we can see that 51% of Novo Nordisk's profits were paid out as dividends in the last 12 months. This is a healthy payout ratio, and while it does limit the amount of earnings that can be reinvested in the business, there is also some room to lift the payout ratio over time.
We also measure dividends paid against a company's levered free cash flow, to see if enough cash was generated to cover the dividend. Novo Nordisk paid out 61% of its cash flow as dividends last year, which is within a reasonable range for the average corporation. It's encouraging to see that the dividend is covered by both profit and cash flow. This generally suggests the dividend is sustainable, as long as earnings don't drop precipitously.
We update our data on Novo Nordisk every 24 hours, so you can always get our latest analysis of its financial health, here.
Dividend Volatility
One of the major risks of relying on dividend income, is the potential for a company to struggle financially and cut its dividend. Not only is your income cut, but the value of your investment declines as well - nasty. For the purpose of this article, we only scrutinise the last decade of Novo Nordisk's dividend payments. During the past ten-year period, the first annual payment was ø1.20 in 2009, compared to ø8.15 last year. Dividends per share have grown at approximately 21% per year over this time.
Novo Nordisk has grown distributions at a rapid rate despite cutting the dividend at least once in the past. Companies that cut once often cut again, but it might be worth considering if the business has turned a corner.
Dividend Growth Potential
The other half of the dividend investing equation is evaluating whether earnings per share (EPS) are growing. Over the long term, dividends need to grow at or above the rate of inflation, in order to maintain the recipient's purchasing power. Strong earnings per share (EPS) growth might encourage our interest in the company despite fluctuating dividends, which is why it's great to see Novo Nordisk has grown its earnings per share at 11% per annum over the past five years. Earnings per share have been growing rapidly, but given that it is paying out more than half of its earnings as dividends, we wonder how Novo Nordisk will keep funding its growth projects in the future.
Conclusion
To summarise, shareholders should always check that Novo Nordisk's dividends are affordable, that its dividend payments are relatively stable, and that it has decent prospects for growing its earnings and dividend. Novo Nordisk's is paying out more than half its income as dividends, but at least the dividend is covered by both reported earnings and cashflow. We were also glad to see it growing earnings, but it was concerning to see the dividend has been cut at least once in the past. Ultimately, Novo Nordisk comes up short on our dividend analysis. It's not that we think it is a bad company - just that there are likely more appealing dividend prospects out there on this analysis.
Companies that are growing earnings tend to be the best dividend stocks over the long term. See what the 26 analysts we track are forecasting for Novo Nordisk for free with public analyst estimates for the company.
If you are a dividend investor, you might also want to look at our curated list of dividend stocks yielding above 3%.
We aim to bring you long-term focused research analysis driven by fundamental data. Note that our analysis may not factor in the latest price-sensitive company announcements or qualitative material.
If you spot an error that warrants correction, please contact the editor at editorial-team@simplywallst.com. This article by Simply Wall St is general in nature. It does not constitute a recommendation to buy or sell any stock, and does not take account of your objectives, or your financial situation. Simply Wall St has no position in the stocks mentioned. Thank you for reading.
