
 Yahoo Finance
 Is NOW Inc.'s (NYSE:DNOW) CEO Pay Justified?

Want to participate in a short research study? Help shape the future of investing tools and you could win a $250 gift card!
Robert Workman became the CEO of NOW Inc. (NYSE:DNOW) in 2014. This report will, first, examine the CEO compensation levels in comparison to CEO compensation at companies of similar size. Then we'll look at a snap shot of the business growth. Third, we'll reflect on the total return to shareholders over three years, as a second measure of business performance. This process should give us an idea about how appropriately the CEO is paid.
View our latest analysis for NOW
How Does Robert Workman's Compensation Compare With Similar Sized Companies?
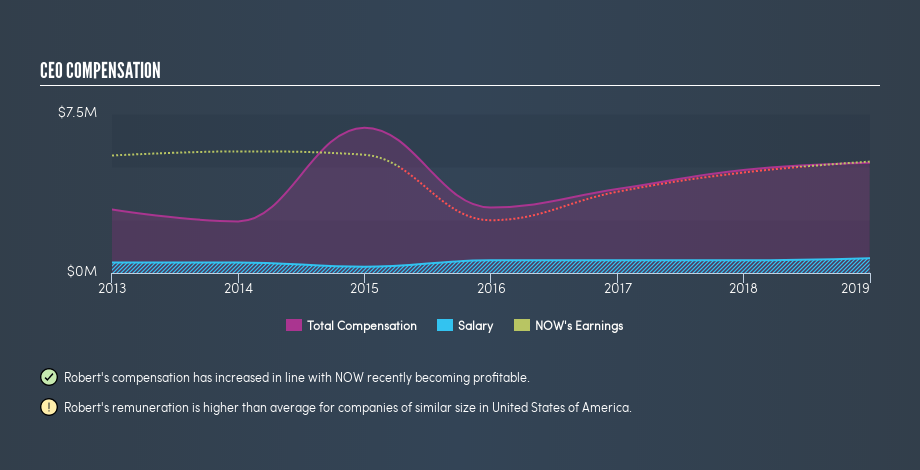
At the time of writing our data says that NOW Inc. has a market cap of US$1.6b, and is paying total annual CEO compensation of US$5.2m. (This figure is for the year to December 2018). We think total compensation is more important but we note that the CEO salary is lower, at US$700k. We looked at a group of companies with market capitalizations from US$1.0b to US$3.2b, and the median CEO total compensation was US$3.9m.
As you can see, Robert Workman is paid more than the median CEO pay at companies of a similar size, in the same market. However, this does not necessarily mean NOW Inc. is paying too much. A closer look at the performance of the underlying business will give us a better idea about whether the pay is particularly generous.
You can see, below, how CEO compensation at NOW has changed over time.
Is NOW Inc. Growing?
NOW Inc. has increased its earnings per share (EPS) by an average of 113% a year, over the last three years (using a line of best fit). It achieved revenue growth of 13% over the last year.
This demonstrates that the company has been improving recently. A good result. It's also good to see decent revenue growth in the last year, suggesting the business is healthy and growing. You might want to check this free visual report on analyst forecasts for future earnings.
Has NOW Inc. Been A Good Investment?
Given the total loss of 24% over three years, many shareholders in NOW Inc. are probably rather dissatisfied, to say the least. So shareholders would probably think the company shouldn't be too generous with CEO compensation.
In Summary...
We compared the total CEO remuneration paid by NOW Inc., and compared it to remuneration at a group of similar sized companies. Our data suggests that it pays above the median CEO pay within that group.
Importantly, though, the company has impressed with its earnings per share growth, over three years. On the other hand returns to investors over the same period have probably disappointed many. Considering the per share profit growth, but keeping in mind the weak returns, we'd need more time to form a view on CEO compensation. Whatever your view on compensation, you might want to check if insiders are buying or selling NOW shares (free trial).
Important note: NOW may not be the best stock to buy. You might find something better in this list of interesting companies with high ROE and low debt.
We aim to bring you long-term focused research analysis driven by fundamental data. Note that our analysis may not factor in the latest price-sensitive company announcements or qualitative material.
If you spot an error that warrants correction, please contact the editor at editorial-team@simplywallst.com. This article by Simply Wall St is general in nature. It does not constitute a recommendation to buy or sell any stock, and does not take account of your objectives, or your financial situation. Simply Wall St has no position in the stocks mentioned. Thank you for reading.
