
 Yahoo Finance
 Is nVent Electric plc (NYSE:NVT) A Smart Choice For Dividend Investors?

Dividend paying stocks like nVent Electric plc (NYSE:NVT) tend to be popular with investors, and for good reason - some research suggests a significant amount of all stock market returns come from reinvested dividends. If you are hoping to live on your dividends, it's important to be more stringent with your investments than the average punter. Regular readers know we like to apply the same approach to each dividend stock, and we hope you'll find our analysis useful.
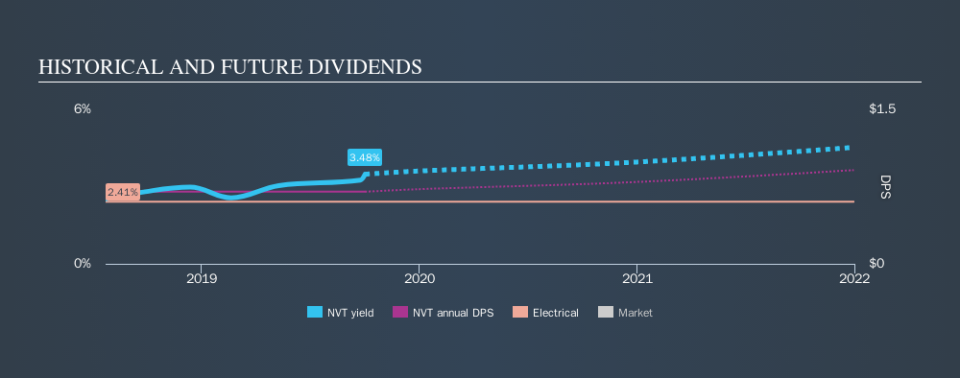
Some readers mightn't know much about nVent Electric's 3.5% dividend, as it has only been paying distributions for a year or so. During the year, the company also conducted a buyback equivalent to around 8.3% of its market capitalisation. There are a few simple ways to reduce the risks of buying nVent Electric for its dividend, and we'll go through these below.
Explore this interactive chart for our latest analysis on nVent Electric!
Payout ratios
Dividends are typically paid from company earnings. If a company pays more in dividends than it earned, then the dividend might become unsustainable - hardly an ideal situation. So we need to form a view on if a company's dividend is sustainable, relative to its net profit after tax. Looking at the data, we can see that 49% of nVent Electric's profits were paid out as dividends in the last 12 months. This is a medium payout level that leaves enough capital in the business to fund opportunities that might arise, while also rewarding shareholders. Plus, there is room to increase the payout ratio over time.
We also measure dividends paid against a company's levered free cash flow, to see if enough cash was generated to cover the dividend. Of the free cash flow it generated last year, nVent Electric paid out 46% as dividends, suggesting the dividend is affordable. It's positive to see that nVent Electric's dividend is covered by both profits and cash flow, since this is generally a sign that the dividend is sustainable, and a lower payout ratio usually suggests a greater margin of safety before the dividend gets cut.
Is nVent Electric's Balance Sheet Risky?
As nVent Electric has a meaningful amount of debt, we need to check its balance sheet to see if the company might have debt risks. A quick check of its financial situation can be done with two ratios: net debt divided by EBITDA (earnings before interest, tax, depreciation and amortisation), and net interest cover. Net debt to EBITDA is a measure of a company's total debt. Net interest cover measures the ability to meet interest payments. Essentially we check that a) the company does not have too much debt, and b) that it can afford to pay the interest. With net debt of 2.29 times its EBITDA, nVent Electric's debt burden is within a normal range for most listed companies.
Net interest cover can be calculated by dividing earnings before interest and tax (EBIT) by the company's net interest expense. Net interest cover of 8.13 times its interest expense appears reasonable for nVent Electric, although we're conscious that even high interest cover doesn't make a company bulletproof.
Consider getting our latest analysis on nVent Electric's financial position here.
Dividend Volatility
One of the major risks of relying on dividend income, is the potential for a company to struggle financially and cut its dividend. Not only is your income cut, but the value of your investment declines as well - nasty. With a payment history of less than 2 years, we think it's a bit too soon to think about living on the income from its dividend. Its most recent annual dividend was US$0.70 per share.
It's good to see at least some dividend growth. Yet with a relatively short dividend paying history, we wouldn't want to depend on this dividend too heavily.
Dividend Growth Potential
The other half of the dividend investing equation is evaluating whether earnings per share (EPS) are growing. Growing EPS can help maintain or increase the purchasing power of the dividend over the long run. nVent Electric's earnings per share are down -23% over the past year. While this is not ideal, one year is a short time in business, and we wouldn't want to get too hung up on this. We do note though, one year is too short a time to be drawing strong conclusions about a company's future prospects.
Conclusion
When we look at a dividend stock, we need to form a judgement on whether the dividend will grow, if the company is able to maintain it in a wide range of economic circumstances, and if the dividend payout is sustainable. First, we like that the company's dividend payments appear well covered, although the retained capital also needs to be effectively reinvested. Earnings per share have been falling, and the company has a relatively short dividend history - shorter than we like, anyway. In sum, we find it hard to get excited about nVent Electric from a dividend perspective. It's not that we think it's a bad business; just that there are other companies that perform better on these criteria.
Without at least some growth in earnings per share over time, the dividend will eventually come under pressure either from costs or inflation. Very few businesses see earnings consistently shrink year after year in perpetuity though, and so it might be worth seeing what the 4 analysts we track are forecasting for the future.
We have also put together a list of global stocks with a market capitalisation above $1bn and yielding more 3%.
We aim to bring you long-term focused research analysis driven by fundamental data. Note that our analysis may not factor in the latest price-sensitive company announcements or qualitative material.
If you spot an error that warrants correction, please contact the editor at editorial-team@simplywallst.com. This article by Simply Wall St is general in nature. It does not constitute a recommendation to buy or sell any stock, and does not take account of your objectives, or your financial situation. Simply Wall St has no position in the stocks mentioned. Thank you for reading.
