
 Yahoo Finance
 NXP Semiconductors (NASDAQ:NXPI) shareholders have earned a 9.8% CAGR over the last five years
If you want to compound wealth in the stock market, you can do so by buying an index fund. But the truth is, you can make significant gains if you buy good quality businesses at the right price. For example, the NXP Semiconductors N.V. (NASDAQ:NXPI) share price is 51% higher than it was five years ago, which is more than the market average. Zooming in, the stock is actually down 22% in the last year.
So let's investigate and see if the longer term performance of the company has been in line with the underlying business' progress.
View our latest analysis for NXP Semiconductors
In his essay The Superinvestors of Graham-and-Doddsville Warren Buffett described how share prices do not always rationally reflect the value of a business. One way to examine how market sentiment has changed over time is to look at the interaction between a company's share price and its earnings per share (EPS).
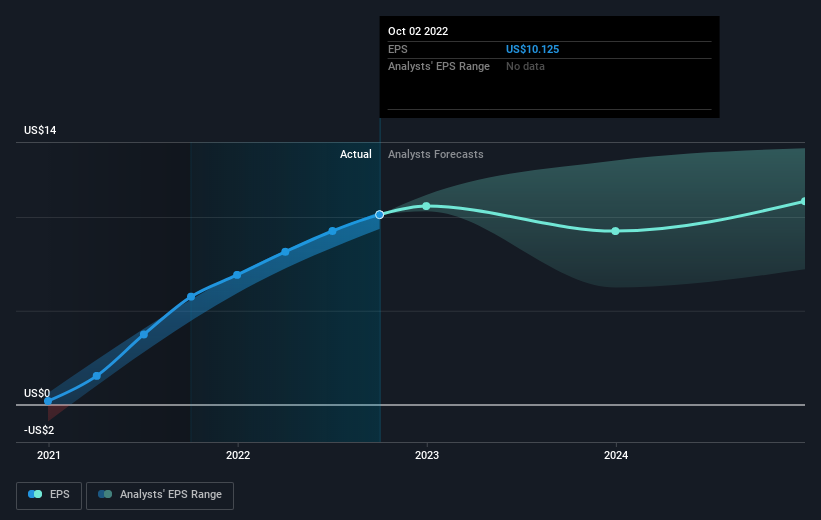
During five years of share price growth, NXP Semiconductors achieved compound earnings per share (EPS) growth of 12% per year. The EPS growth is more impressive than the yearly share price gain of 9% over the same period. Therefore, it seems the market has become relatively pessimistic about the company.
The company's earnings per share (over time) is depicted in the image below (click to see the exact numbers).
We know that NXP Semiconductors has improved its bottom line over the last three years, but what does the future have in store? Take a more thorough look at NXP Semiconductors' financial health with this free report on its balance sheet.
What About Dividends?
When looking at investment returns, it is important to consider the difference between total shareholder return (TSR) and share price return. The TSR incorporates the value of any spin-offs or discounted capital raisings, along with any dividends, based on the assumption that the dividends are reinvested. Arguably, the TSR gives a more comprehensive picture of the return generated by a stock. We note that for NXP Semiconductors the TSR over the last 5 years was 59%, which is better than the share price return mentioned above. This is largely a result of its dividend payments!
A Different Perspective
While the broader market lost about 15% in the twelve months, NXP Semiconductors shareholders did even worse, losing 21% (even including dividends). However, it could simply be that the share price has been impacted by broader market jitters. It might be worth keeping an eye on the fundamentals, in case there's a good opportunity. Longer term investors wouldn't be so upset, since they would have made 10%, each year, over five years. If the fundamental data continues to indicate long term sustainable growth, the current sell-off could be an opportunity worth considering. I find it very interesting to look at share price over the long term as a proxy for business performance. But to truly gain insight, we need to consider other information, too. Consider for instance, the ever-present spectre of investment risk. We've identified 2 warning signs with NXP Semiconductors , and understanding them should be part of your investment process.
Of course, you might find a fantastic investment by looking elsewhere. So take a peek at this free list of companies we expect will grow earnings.
Please note, the market returns quoted in this article reflect the market weighted average returns of stocks that currently trade on US exchanges.
Have feedback on this article? Concerned about the content? Get in touch with us directly. Alternatively, email editorial-team (at) simplywallst.com.
This article by Simply Wall St is general in nature. We provide commentary based on historical data and analyst forecasts only using an unbiased methodology and our articles are not intended to be financial advice. It does not constitute a recommendation to buy or sell any stock, and does not take account of your objectives, or your financial situation. We aim to bring you long-term focused analysis driven by fundamental data. Note that our analysis may not factor in the latest price-sensitive company announcements or qualitative material. Simply Wall St has no position in any stocks mentioned.
Join A Paid User Research Session
You’ll receive a US$30 Amazon Gift card for 1 hour of your time while helping us build better investing tools for the individual investors like yourself. Sign up here
