
 Yahoo Finance
 Ocado Group plc (LON:OCDO): Time For A Financial Health Check

Investors seeking to preserve capital in a volatile environment might consider large-cap stocks such as Ocado Group plc (LON:OCDO) a safer option. One reason being its ‘too big to fail’ aura which gives it the appearance of a strong and stable investment. But, its financial health remains the key to continued success. Today we will look at Ocado Group’s financial liquidity and debt levels, which are strong indicators for whether the company can weather economic downturns or fund strategic acquisitions for future growth. Note that this commentary is very high-level and solely focused on financial health, so I suggest you dig deeper yourself into OCDO here.
Want to participate in a short research study? Help shape the future of investing tools and you could win a $250 gift card!
See our latest analysis for Ocado Group
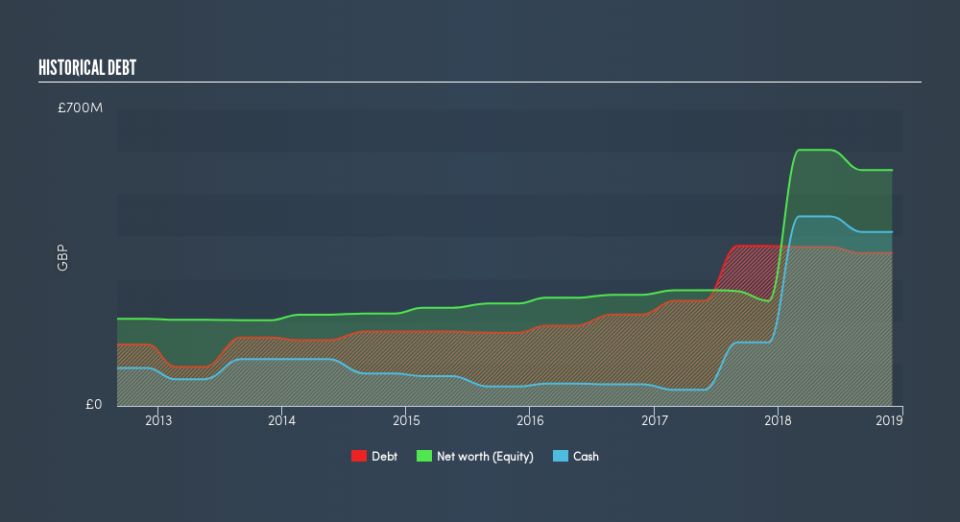
Does OCDO Produce Much Cash Relative To Its Debt?
Over the past year, OCDO has maintained its debt levels at around UK£361m which accounts for long term debt. At this constant level of debt, the current cash and short-term investment levels stands at UK£411m , ready to be used for running the business. On top of this, OCDO has generated UK£128m in operating cash flow in the last twelve months, resulting in an operating cash to total debt ratio of 36%, indicating that OCDO’s operating cash is sufficient to cover its debt.
Can OCDO pay its short-term liabilities?
Looking at OCDO’s UK£329m in current liabilities, it appears that the company has been able to meet these obligations given the level of current assets of UK£576m, with a current ratio of 1.75x. The current ratio is calculated by dividing current assets by current liabilities. Usually, for Online Retail companies, this is a suitable ratio since there is a bit of a cash buffer without leaving too much capital in a low-return environment.
Can OCDO service its debt comfortably?
With a debt-to-equity ratio of 65%, OCDO can be considered as an above-average leveraged company. This isn’t uncommon for large companies because interest payments on debt are tax deductible, meaning debt can be a cheaper source of capital than equity. Accordingly, large companies often have lower cost of capital due to easily obtained financing, providing an advantage over smaller companies. Though, since OCDO is presently loss-making, there’s a question of sustainability of its current operations. Running high debt, while not yet making money, can be risky in unexpected downturns as liquidity may dry up, making it hard to operate.
Next Steps:
OCDO’s high cash coverage means that, although its debt levels are high, the company is able to utilise its borrowings efficiently in order to generate cash flow. Since there is also no concerns around OCDO's liquidity needs, this may be its optimal capital structure for the time being. I admit this is a fairly basic analysis for OCDO's financial health. Other important fundamentals need to be considered alongside. You should continue to research Ocado Group to get a better picture of the large-cap by looking at:
Future Outlook: What are well-informed industry analysts predicting for OCDO’s future growth? Take a look at our free research report of analyst consensus for OCDO’s outlook.
Historical Performance: What has OCDO's returns been like over the past? Go into more detail in the past track record analysis and take a look at the free visual representations of our analysis for more clarity.
Other High-Performing Stocks: Are there other stocks that provide better prospects with proven track records? Explore our free list of these great stocks here.
We aim to bring you long-term focused research analysis driven by fundamental data. Note that our analysis may not factor in the latest price-sensitive company announcements or qualitative material.
If you spot an error that warrants correction, please contact the editor at editorial-team@simplywallst.com. This article by Simply Wall St is general in nature. It does not constitute a recommendation to buy or sell any stock, and does not take account of your objectives, or your financial situation. Simply Wall St has no position in the stocks mentioned. Thank you for reading.
