
 Yahoo Finance
 Is OCK Group Berhad's (KLSE:OCK) Recent Stock Performance Influenced By Its Fundamentals In Any Way?
Most readers would already be aware that OCK Group Berhad's (KLSE:OCK) stock increased significantly by 44% over the past three months. Given that stock prices are usually aligned with a company's financial performance in the long-term, we decided to study its financial indicators more closely to see if they had a hand to play in the recent price move. Particularly, we will be paying attention to OCK Group Berhad's ROE today.
Return on equity or ROE is an important factor to be considered by a shareholder because it tells them how effectively their capital is being reinvested. In short, ROE shows the profit each dollar generates with respect to its shareholder investments.
View our latest analysis for OCK Group Berhad
How To Calculate Return On Equity?
ROE can be calculated by using the formula:
Return on Equity = Net Profit (from continuing operations) ÷ Shareholders' Equity
So, based on the above formula, the ROE for OCK Group Berhad is:
5.7% = RM46m ÷ RM803m (Based on the trailing twelve months to September 2023).
The 'return' is the income the business earned over the last year. So, this means that for every MYR1 of its shareholder's investments, the company generates a profit of MYR0.06.
What Has ROE Got To Do With Earnings Growth?
We have already established that ROE serves as an efficient profit-generating gauge for a company's future earnings. Depending on how much of these profits the company reinvests or "retains", and how effectively it does so, we are then able to assess a company’s earnings growth potential. Generally speaking, other things being equal, firms with a high return on equity and profit retention, have a higher growth rate than firms that don’t share these attributes.
A Side By Side comparison of OCK Group Berhad's Earnings Growth And 5.7% ROE
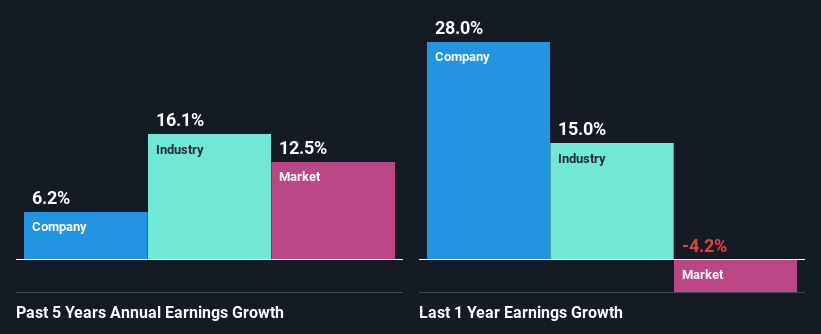
On the face of it, OCK Group Berhad's ROE is not much to talk about. A quick further study shows that the company's ROE doesn't compare favorably to the industry average of 7.6% either. Although, we can see that OCK Group Berhad saw a modest net income growth of 6.2% over the past five years. So, the growth in the company's earnings could probably have been caused by other variables. For instance, the company has a low payout ratio or is being managed efficiently.
Next, on comparing with the industry net income growth, we found that OCK Group Berhad's reported growth was lower than the industry growth of 16% over the last few years, which is not something we like to see.
Earnings growth is a huge factor in stock valuation. What investors need to determine next is if the expected earnings growth, or the lack of it, is already built into the share price. By doing so, they will have an idea if the stock is headed into clear blue waters or if swampy waters await. One good indicator of expected earnings growth is the P/E ratio which determines the price the market is willing to pay for a stock based on its earnings prospects. So, you may want to check if OCK Group Berhad is trading on a high P/E or a low P/E, relative to its industry.
Is OCK Group Berhad Efficiently Re-investing Its Profits?
While the company did pay out a portion of its dividend in the past, it currently doesn't pay a dividend. We infer that the company has been reinvesting all of its profits to grow its business.
Summary
Overall, we feel that OCK Group Berhad certainly does have some positive factors to consider. Specifically, its fairly high earnings growth number, which no doubt was backed by the company's high earnings retention. Still, the low ROE means that all that reinvestment is not reaping a lot of benefit to the investors. That being so, the latest analyst forecasts show that the company will continue to see an expansion in its earnings. To know more about the latest analysts predictions for the company, check out this visualization of analyst forecasts for the company.
Have feedback on this article? Concerned about the content? Get in touch with us directly. Alternatively, email editorial-team (at) simplywallst.com.
This article by Simply Wall St is general in nature. We provide commentary based on historical data and analyst forecasts only using an unbiased methodology and our articles are not intended to be financial advice. It does not constitute a recommendation to buy or sell any stock, and does not take account of your objectives, or your financial situation. We aim to bring you long-term focused analysis driven by fundamental data. Note that our analysis may not factor in the latest price-sensitive company announcements or qualitative material. Simply Wall St has no position in any stocks mentioned.
