
 Yahoo Finance
 Is Offerpad Solutions Inc.'s (NYSE:OPAD) ROE Of 16% Impressive?
Many investors are still learning about the various metrics that can be useful when analysing a stock. This article is for those who would like to learn about Return On Equity (ROE). By way of learning-by-doing, we'll look at ROE to gain a better understanding of Offerpad Solutions Inc. (NYSE:OPAD).
Return on equity or ROE is an important factor to be considered by a shareholder because it tells them how effectively their capital is being reinvested. In other words, it is a profitability ratio which measures the rate of return on the capital provided by the company's shareholders.
Check out our latest analysis for Offerpad Solutions
How To Calculate Return On Equity?
The formula for return on equity is:
Return on Equity = Net Profit (from continuing operations) ÷ Shareholders' Equity
So, based on the above formula, the ROE for Offerpad Solutions is:
16% = US$48m ÷ US$303m (Based on the trailing twelve months to March 2022).
The 'return' is the yearly profit. That means that for every $1 worth of shareholders' equity, the company generated $0.16 in profit.
Does Offerpad Solutions Have A Good Return On Equity?
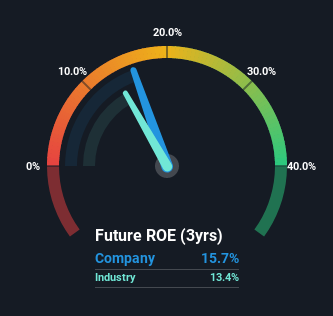
One simple way to determine if a company has a good return on equity is to compare it to the average for its industry. However, this method is only useful as a rough check, because companies do differ quite a bit within the same industry classification. The image below shows that Offerpad Solutions has an ROE that is roughly in line with the Real Estate industry average (13%).
So while the ROE is not exceptional, at least its acceptable. While at least the ROE is not lower than the industry, its still worth checking what role the company's debt plays as high debt levels relative to equity may also make the ROE appear high. If a company takes on too much debt, it is at higher risk of defaulting on interest payments. You can see the 3 risks we have identified for Offerpad Solutions by visiting our risks dashboard for free on our platform here.
Why You Should Consider Debt When Looking At ROE
Most companies need money -- from somewhere -- to grow their profits. That cash can come from retained earnings, issuing new shares (equity), or debt. In the first two cases, the ROE will capture this use of capital to grow. In the latter case, the debt used for growth will improve returns, but won't affect the total equity. That will make the ROE look better than if no debt was used.
Offerpad Solutions' Debt And Its 16% ROE
Offerpad Solutions does use a high amount of debt to increase returns. It has a debt to equity ratio of 2.59. While its ROE is pretty respectable, the amount of debt the company is carrying currently is not ideal. Debt increases risk and reduces options for the company in the future, so you generally want to see some good returns from using it.
Conclusion
Return on equity is a useful indicator of the ability of a business to generate profits and return them to shareholders. A company that can achieve a high return on equity without debt could be considered a high quality business. If two companies have around the same level of debt to equity, and one has a higher ROE, I'd generally prefer the one with higher ROE.
Having said that, while ROE is a useful indicator of business quality, you'll have to look at a whole range of factors to determine the right price to buy a stock. It is important to consider other factors, such as future profit growth -- and how much investment is required going forward. So you might want to take a peek at this data-rich interactive graph of forecasts for the company.
If you would prefer check out another company -- one with potentially superior financials -- then do not miss this free list of interesting companies, that have HIGH return on equity and low debt.
Have feedback on this article? Concerned about the content? Get in touch with us directly. Alternatively, email editorial-team (at) simplywallst.com.
This article by Simply Wall St is general in nature. We provide commentary based on historical data and analyst forecasts only using an unbiased methodology and our articles are not intended to be financial advice. It does not constitute a recommendation to buy or sell any stock, and does not take account of your objectives, or your financial situation. We aim to bring you long-term focused analysis driven by fundamental data. Note that our analysis may not factor in the latest price-sensitive company announcements or qualitative material. Simply Wall St has no position in any stocks mentioned.