Oil Price Rally Impacts High Yield Bonds
In early 2016, when the oil market was in tatters, market participants were waiting for a definitive policy announcement from the intergovernmental body OPEC to reduce the supply/demand imbalance and support the oil price. In the end, this never came and the market was left to its own devices, finally finding support at approximately $26 a barrel in February. Fast forward eight-months with the oil price around $50, we have finally seen OPEC make a move.
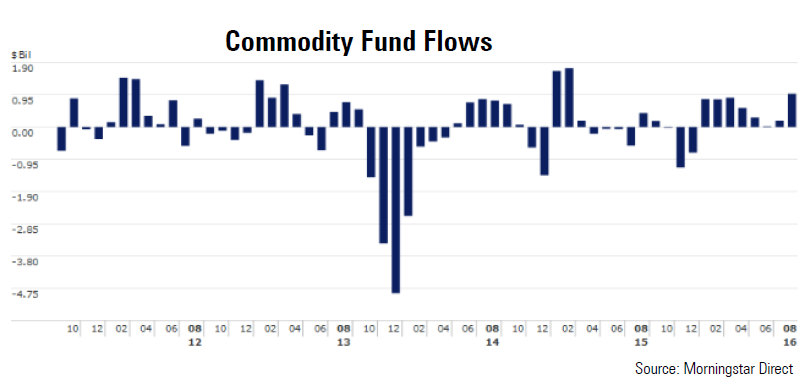
Despite the late arrival, OPEC has indicated an output freeze will likely transpire, which is important given OPEC represents approximately 43% of the world’s oil output and 73% of “proven” oil reserves, as of 2015. Even countries outside OPEC, including Russia, appear supportive of action to reduce the supply overhang and seemingly committed to curbing production too. This is generally supporting commodity sentiment, with oil hitting a 15-month high and follows a strong level of inflows to commodities through August.

The problem is that any supply constraint could prove temporary, especially given the economic positioning of the middle-east. As a point of reference, Saudi Arabia has historically been the swing producer and is still dealing with a significant debt overhang from the oil crash. Therefore, any commodity-related exposure is at the mercy of market manipulation by oil producers.
Linking Oil to the Markets
In terms of market impact, we know that commodity prices have the ability to drive asset price movements. Some of these links are obvious such as the relationship between the oil price and energy stocks, or more broadly with the headline inflation rate. It is therefore unsurprising that we are already seeing early signs of energy stocks staging a comeback, albeit from very low levels. We have long favoured European energy stocks from a valuation perspective and hence many of our portfolios have benefitted from this latest move.
There are far more subtle relationships to oil though, and one of the most significant to our portfolio framework at the current time is the link between the oil price and high yield debt.

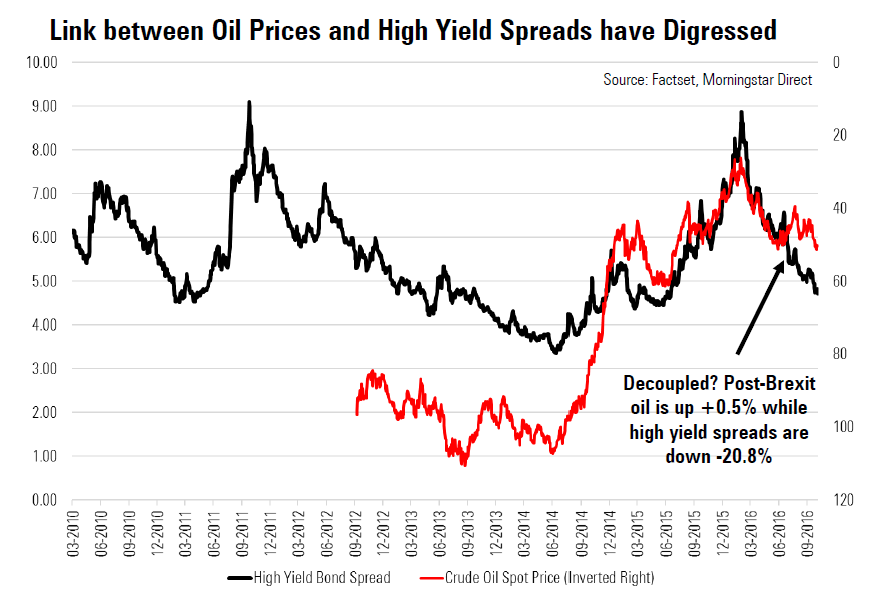
We can see in the chart that the link between oil and high yield debt has been exceptionally strong since 2015 in inverted terms. In fact, the r-squared is 0.73 in 2015 and 2016, meaning as much as 73% of the high yield curve variability can supposedly be explained by oil price moves. This makes for an interesting gauge to watch, especially given the speculative nature of oil prices and the unusual interaction of OPEC.
To our way of thinking, this requires two levels of analysis: Is the relationship between oil and high yield debt a valid one? Should we expect this relationship to hold true into the future? If so, have the high yield spreads narrowed too far or has the oil price not rallied enough? Is it causal or merely coincidental?
We know that a sizable component of the high yield index is made up of energy-related corporates, estimated to be 14% for the U.S. high yield index and 12.5% for the global index, which is high enough to believe the relationship has valid reasoning but not so strong to explain 73% of the variability.
We also know with historical context that the relationship can break-down severely. For example, in the period from mid- to late-2014 when oil crashed and high yield spreads only increased by approximately 1%. Therefore, this is a risk factor we need to watch, although we gain greater conviction in high yield debt by tracking fair values on the basis of default risks, yield curve changes, spread levels and underlying inflation expectations. The volatility in the oil price is just an added complexity we need to be aware of.

 Yahoo Finance