
 Yahoo Finance
 The one-year earnings decline is not helping Bridgepoint Group's (LON:BPT share price, as stock falls another 8.7% in past week
Investors can approximate the average market return by buying an index fund. Active investors aim to buy stocks that vastly outperform the market - but in the process, they risk under-performance. Investors in Bridgepoint Group plc (LON:BPT) have tasted that bitter downside in the last year, as the share price dropped 49%. That's well below the market decline of 4.1%. Bridgepoint Group hasn't been listed for long, so although we're wary of recent listings that perform poorly, it may still prove itself with time. The falls have accelerated recently, with the share price down 15% in the last three months. We note that the company has reported results fairly recently; and the market is hardly delighted. You can check out the latest numbers in our company report.
Since Bridgepoint Group has shed UK£201m from its value in the past 7 days, let's see if the longer term decline has been driven by the business' economics.
View our latest analysis for Bridgepoint Group
To quote Buffett, 'Ships will sail around the world but the Flat Earth Society will flourish. There will continue to be wide discrepancies between price and value in the marketplace...' One way to examine how market sentiment has changed over time is to look at the interaction between a company's share price and its earnings per share (EPS).
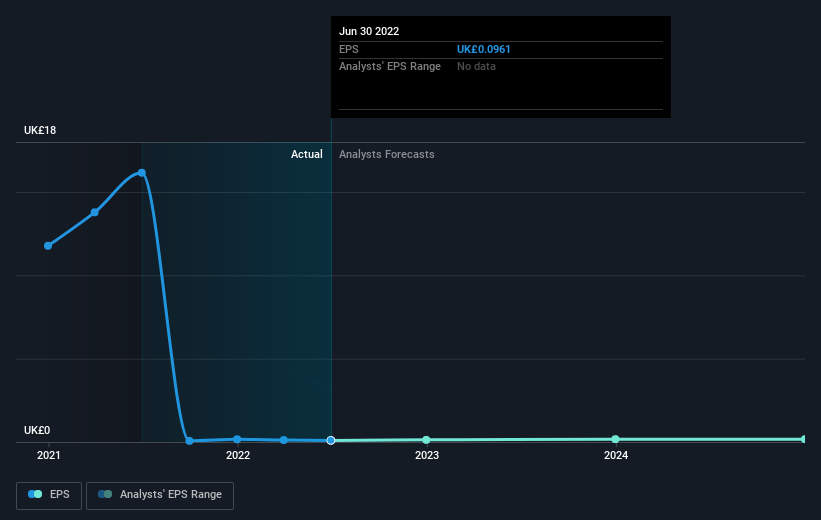
Unhappily, Bridgepoint Group had to report a 99% decline in EPS over the last year. The share price fall of 49% isn't as bad as the reduction in earnings per share. So despite the weak per-share profits, some investors are probably relieved the situation wasn't more difficult.
The image below shows how EPS has tracked over time (if you click on the image you can see greater detail).
It might be well worthwhile taking a look at our free report on Bridgepoint Group's earnings, revenue and cash flow.
A Different Perspective
We doubt Bridgepoint Group shareholders are happy with the loss of 48% over twelve months (even including dividends). That falls short of the market, which lost 4.1%. There's no doubt that's a disappointment, but the stock may well have fared better in a stronger market. With the stock down 15% over the last three months, the market doesn't seem to believe that the company has solved all its problems. Basically, most investors should be wary of buying into a poor-performing stock, unless the business itself has clearly improved. While it is well worth considering the different impacts that market conditions can have on the share price, there are other factors that are even more important. For instance, we've identified 1 warning sign for Bridgepoint Group that you should be aware of.
Of course Bridgepoint Group may not be the best stock to buy. So you may wish to see this free collection of growth stocks.
Please note, the market returns quoted in this article reflect the market weighted average returns of stocks that currently trade on GB exchanges.
Have feedback on this article? Concerned about the content? Get in touch with us directly. Alternatively, email editorial-team (at) simplywallst.com.
This article by Simply Wall St is general in nature. We provide commentary based on historical data and analyst forecasts only using an unbiased methodology and our articles are not intended to be financial advice. It does not constitute a recommendation to buy or sell any stock, and does not take account of your objectives, or your financial situation. We aim to bring you long-term focused analysis driven by fundamental data. Note that our analysis may not factor in the latest price-sensitive company announcements or qualitative material. Simply Wall St has no position in any stocks mentioned.
Join A Paid User Research Session
You’ll receive a US$30 Amazon Gift card for 1 hour of your time while helping us build better investing tools for the individual investors like yourself. Sign up here
