
 Yahoo Finance
 All for One Group SE's (ETR:A1OS) Stock Has Seen Strong Momentum: Does That Call For Deeper Study Of Its Financial Prospects?
All for One Group (ETR:A1OS) has had a great run on the share market with its stock up by a significant 20% over the last three months. Given that stock prices are usually aligned with a company's financial performance in the long-term, we decided to study its financial indicators more closely to see if they had a hand to play in the recent price move. Particularly, we will be paying attention to All for One Group's ROE today.
Return on equity or ROE is a key measure used to assess how efficiently a company's management is utilizing the company's capital. In other words, it is a profitability ratio which measures the rate of return on the capital provided by the company's shareholders.
View our latest analysis for All for One Group
How Is ROE Calculated?
The formula for return on equity is:
Return on Equity = Net Profit (from continuing operations) ÷ Shareholders' Equity
So, based on the above formula, the ROE for All for One Group is:
11% = €12m ÷ €109m (Based on the trailing twelve months to December 2023).
The 'return' is the yearly profit. One way to conceptualize this is that for each €1 of shareholders' capital it has, the company made €0.11 in profit.
What Is The Relationship Between ROE And Earnings Growth?
So far, we've learned that ROE is a measure of a company's profitability. Based on how much of its profits the company chooses to reinvest or "retain", we are then able to evaluate a company's future ability to generate profits. Assuming all else is equal, companies that have both a higher return on equity and higher profit retention are usually the ones that have a higher growth rate when compared to companies that don't have the same features.
All for One Group's Earnings Growth And 11% ROE
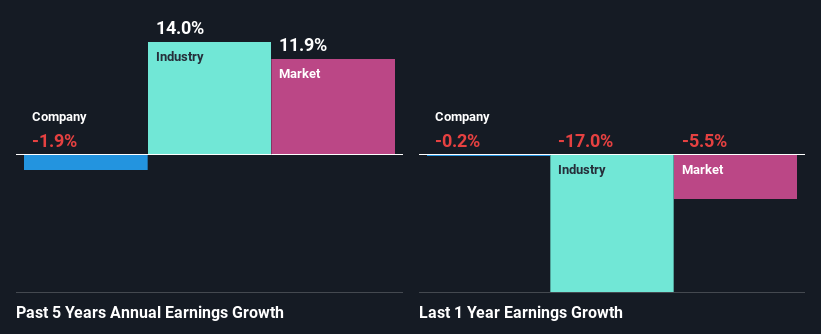
To begin with, All for One Group seems to have a respectable ROE. Even when compared to the industry average of 9.2% the company's ROE looks quite decent. Given the circumstances, we can't help but wonder why All for One Group saw little to no growth in the past five years. So, there could be some other aspects that could potentially be preventing the company from growing. Such as, the company pays out a huge portion of its earnings as dividends, or is faced with competitive pressures.
As a next step, we compared All for One Group's net income growth with the industry and discovered that the industry saw an average growth of 14% in the same period.
Earnings growth is a huge factor in stock valuation. It’s important for an investor to know whether the market has priced in the company's expected earnings growth (or decline). This then helps them determine if the stock is placed for a bright or bleak future. One good indicator of expected earnings growth is the P/E ratio which determines the price the market is willing to pay for a stock based on its earnings prospects. So, you may want to check if All for One Group is trading on a high P/E or a low P/E, relative to its industry.
Is All for One Group Using Its Retained Earnings Effectively?
All for One Group has a high three-year median payout ratio of 61% (or a retention ratio of 39%), meaning that the company is paying most of its profits as dividends to its shareholders. This does go some way in explaining why there's been no growth in its earnings.
Additionally, All for One Group has paid dividends over a period of at least ten years, which means that the company's management is determined to pay dividends even if it means little to no earnings growth. Upon studying the latest analysts' consensus data, we found that the company's future payout ratio is expected to drop to 36% over the next three years. The fact that the company's ROE is expected to rise to 18% over the same period is explained by the drop in the payout ratio.
Summary
Overall, we feel that All for One Group certainly does have some positive factors to consider. Yet, the low earnings growth is a bit concerning, especially given that the company has a high rate of return. Investors could have benefitted from the high ROE, had the company been reinvesting more of its earnings. As discussed earlier, the company is retaining a small portion of its profits. With that said, we studied the latest analyst forecasts and found that while the company has shrunk its earnings in the past, analysts expect its earnings to grow in the future. Are these analysts expectations based on the broad expectations for the industry, or on the company's fundamentals? Click here to be taken to our analyst's forecasts page for the company.
Have feedback on this article? Concerned about the content? Get in touch with us directly. Alternatively, email editorial-team (at) simplywallst.com.
This article by Simply Wall St is general in nature. We provide commentary based on historical data and analyst forecasts only using an unbiased methodology and our articles are not intended to be financial advice. It does not constitute a recommendation to buy or sell any stock, and does not take account of your objectives, or your financial situation. We aim to bring you long-term focused analysis driven by fundamental data. Note that our analysis may not factor in the latest price-sensitive company announcements or qualitative material. Simply Wall St has no position in any stocks mentioned.
