
 Yahoo Finance
 The one-year loss for Lufax Holding (NYSE:LU) shareholders likely driven by its shrinking earnings
While not a mind-blowing move, it is good to see that the Lufax Holding Ltd (NYSE:LU) share price has gained 14% in the last three months. But that is minimal compensation for the share price under-performance over the last year. After all, the share price is down 55% in the last year, significantly under-performing the market.
Although the past week has been more reassuring for shareholders, they're still in the red over the last year, so let's see if the underlying business has been responsible for the decline.
View our latest analysis for Lufax Holding
In his essay The Superinvestors of Graham-and-Doddsville Warren Buffett described how share prices do not always rationally reflect the value of a business. By comparing earnings per share (EPS) and share price changes over time, we can get a feel for how investor attitudes to a company have morphed over time.
Unhappily, Lufax Holding had to report a 24% decline in EPS over the last year. The share price decline of 55% is actually more than the EPS drop. Unsurprisingly, given the lack of EPS growth, the market seems to be more cautious about the stock. The P/E ratio of 3.00 also points to the negative market sentiment.
The company's earnings per share (over time) is depicted in the image below (click to see the exact numbers).
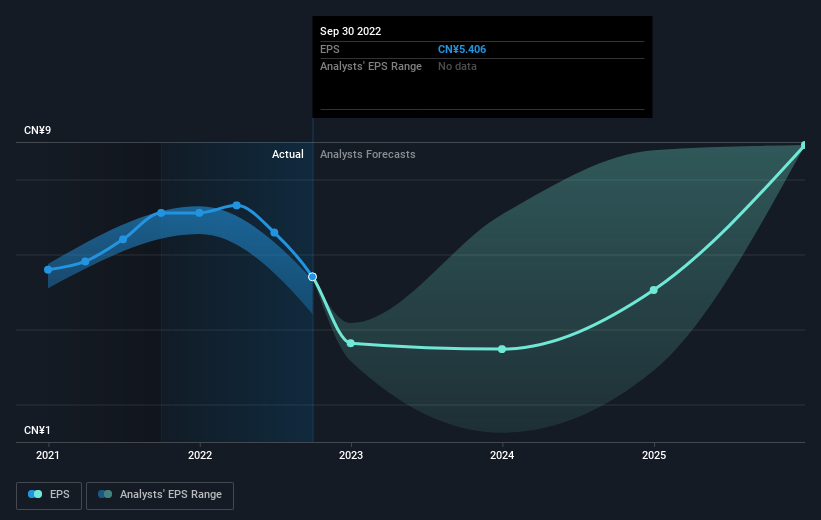
Dive deeper into Lufax Holding's key metrics by checking this interactive graph of Lufax Holding's earnings, revenue and cash flow.
What About Dividends?
As well as measuring the share price return, investors should also consider the total shareholder return (TSR). The TSR incorporates the value of any spin-offs or discounted capital raisings, along with any dividends, based on the assumption that the dividends are reinvested. So for companies that pay a generous dividend, the TSR is often a lot higher than the share price return. In the case of Lufax Holding, it has a TSR of -49% for the last 1 year. That exceeds its share price return that we previously mentioned. The dividends paid by the company have thusly boosted the total shareholder return.
A Different Perspective
We doubt Lufax Holding shareholders are happy with the loss of 49% over twelve months (even including dividends). That falls short of the market, which lost 6.1%. That's disappointing, but it's worth keeping in mind that the market-wide selling wouldn't have helped. Putting aside the last twelve months, it's good to see the share price has rebounded by 14%, in the last ninety days. This could just be a bounce because the selling was too aggressive, but fingers crossed it's the start of a new trend. It's always interesting to track share price performance over the longer term. But to understand Lufax Holding better, we need to consider many other factors. Even so, be aware that Lufax Holding is showing 3 warning signs in our investment analysis , you should know about...
If you would prefer to check out another company -- one with potentially superior financials -- then do not miss this free list of companies that have proven they can grow earnings.
Please note, the market returns quoted in this article reflect the market weighted average returns of stocks that currently trade on US exchanges.
Have feedback on this article? Concerned about the content? Get in touch with us directly. Alternatively, email editorial-team (at) simplywallst.com.
This article by Simply Wall St is general in nature. We provide commentary based on historical data and analyst forecasts only using an unbiased methodology and our articles are not intended to be financial advice. It does not constitute a recommendation to buy or sell any stock, and does not take account of your objectives, or your financial situation. We aim to bring you long-term focused analysis driven by fundamental data. Note that our analysis may not factor in the latest price-sensitive company announcements or qualitative material. Simply Wall St has no position in any stocks mentioned.
Join A Paid User Research Session
You’ll receive a US$30 Amazon Gift card for 1 hour of your time while helping us build better investing tools for the individual investors like yourself. Sign up here
