
 Yahoo Finance
 One Media iP Group (LON:OMIP) Is Experiencing Growth In Returns On Capital
If you're not sure where to start when looking for the next multi-bagger, there are a few key trends you should keep an eye out for. One common approach is to try and find a company with returns on capital employed (ROCE) that are increasing, in conjunction with a growing amount of capital employed. This shows us that it's a compounding machine, able to continually reinvest its earnings back into the business and generate higher returns. Speaking of which, we noticed some great changes in One Media iP Group's (LON:OMIP) returns on capital, so let's have a look.
Return On Capital Employed (ROCE): What is it?
If you haven't worked with ROCE before, it measures the 'return' (pre-tax profit) a company generates from capital employed in its business. The formula for this calculation on One Media iP Group is:
Return on Capital Employed = Earnings Before Interest and Tax (EBIT) ÷ (Total Assets - Current Liabilities)
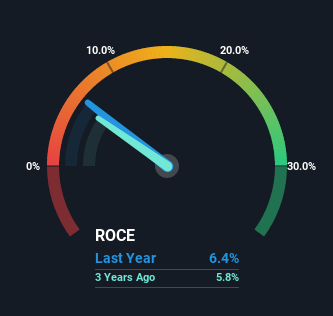
0.064 = UK£1.1m ÷ (UK£18m - UK£1.0m) (Based on the trailing twelve months to October 2021).
Thus, One Media iP Group has an ROCE of 6.4%. In absolute terms, that's a low return and it also under-performs the Entertainment industry average of 16%.
Check out our latest analysis for One Media iP Group
Above you can see how the current ROCE for One Media iP Group compares to its prior returns on capital, but there's only so much you can tell from the past. If you'd like, you can check out the forecasts from the analysts covering One Media iP Group here for free.
How Are Returns Trending?
We're glad to see that ROCE is heading in the right direction, even if it is still low at the moment. Over the last five years, returns on capital employed have risen substantially to 6.4%. The amount of capital employed has increased too, by 380%. So we're very much inspired by what we're seeing at One Media iP Group thanks to its ability to profitably reinvest capital.
One more thing to note, One Media iP Group has decreased current liabilities to 5.9% of total assets over this period, which effectively reduces the amount of funding from suppliers or short-term creditors. So shareholders would be pleased that the growth in returns has mostly come from underlying business performance.
The Bottom Line On One Media iP Group's ROCE
All in all, it's terrific to see that One Media iP Group is reaping the rewards from prior investments and is growing its capital base. And a remarkable 158% total return over the last five years tells us that investors are expecting more good things to come in the future. In light of that, we think it's worth looking further into this stock because if One Media iP Group can keep these trends up, it could have a bright future ahead.
One Media iP Group does come with some risks though, we found 2 warning signs in our investment analysis, and 1 of those is a bit concerning...
If you want to search for solid companies with great earnings, check out this free list of companies with good balance sheets and impressive returns on equity.
Have feedback on this article? Concerned about the content? Get in touch with us directly. Alternatively, email editorial-team (at) simplywallst.com.
This article by Simply Wall St is general in nature. We provide commentary based on historical data and analyst forecasts only using an unbiased methodology and our articles are not intended to be financial advice. It does not constitute a recommendation to buy or sell any stock, and does not take account of your objectives, or your financial situation. We aim to bring you long-term focused analysis driven by fundamental data. Note that our analysis may not factor in the latest price-sensitive company announcements or qualitative material. Simply Wall St has no position in any stocks mentioned.
