
 Yahoo Finance
 The one-year returns have been decent for Indiva (CVE:NDVA) shareholders despite underlying losses increasing
Passive investing in index funds can generate returns that roughly match the overall market. But one can do better than that by picking better than average stocks (as part of a diversified portfolio). For example, the Indiva Limited (CVE:NDVA) share price is up 82% in the last 1 year, clearly besting the market return of around 29% (not including dividends). So that should have shareholders smiling. On the other hand, longer term shareholders have had a tougher run, with the stock falling 45% in three years.
On the back of a solid 7-day performance, let's check what role the company's fundamentals have played in driving long term shareholder returns.
Check out our latest analysis for Indiva
Given that Indiva didn't make a profit in the last twelve months, we'll focus on revenue growth to form a quick view of its business development. When a company doesn't make profits, we'd generally expect to see good revenue growth. As you can imagine, fast revenue growth, when maintained, often leads to fast profit growth.
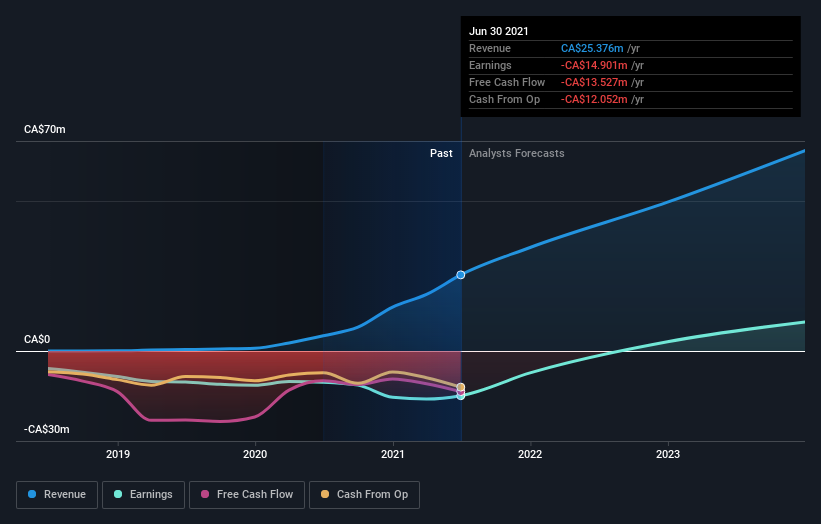
In the last year Indiva saw its revenue grow by 399%. That's a head and shoulders above most loss-making companies. While the share price gain of 82% over twelve months is pretty tasty, you might argue it doesn't fully reflect the strong revenue growth. So quite frankly it could be a good time to investigate Indiva in some detail. Since we evolved from monkeys, we think in linear terms by nature. So if growth goes exponential, opportunity may exist for the enlightened.
The graphic below depicts how earnings and revenue have changed over time (unveil the exact values by clicking on the image).
We like that insiders have been buying shares in the last twelve months. Having said that, most people consider earnings and revenue growth trends to be a more meaningful guide to the business. This free report showing analyst forecasts should help you form a view on Indiva
A Different Perspective
Pleasingly, Indiva's total shareholder return last year was 82%. This recent result is much better than the 13% drop suffered by shareholders each year (on average) over the last three. It could well be that the business has turned around -- or else regained the confidence of investors. I find it very interesting to look at share price over the long term as a proxy for business performance. But to truly gain insight, we need to consider other information, too. Case in point: We've spotted 4 warning signs for Indiva you should be aware of, and 1 of them is potentially serious.
If you like to buy stocks alongside management, then you might just love this free list of companies. (Hint: insiders have been buying them).
Please note, the market returns quoted in this article reflect the market weighted average returns of stocks that currently trade on CA exchanges.
This article by Simply Wall St is general in nature. We provide commentary based on historical data and analyst forecasts only using an unbiased methodology and our articles are not intended to be financial advice. It does not constitute a recommendation to buy or sell any stock, and does not take account of your objectives, or your financial situation. We aim to bring you long-term focused analysis driven by fundamental data. Note that our analysis may not factor in the latest price-sensitive company announcements or qualitative material. Simply Wall St has no position in any stocks mentioned.
Have feedback on this article? Concerned about the content? Get in touch with us directly. Alternatively, email editorial-team (at) simplywallst.com.
