
 Yahoo Finance
 One Thing To Remember About The Grainger plc (LON:GRI) Share Price

If you’re interested in Grainger plc (LON:GRI), then you might want to consider its beta (a measure of share price volatility) in order to understand how the stock could impact your portfolio. Volatility is considered to be a measure of risk in modern finance theory. Investors may think of volatility as falling into two main categories. The first type is company specific volatility. Investors use diversification across uncorrelated stocks to reduce this kind of price volatility across the portfolio. The other type, which cannot be diversified away, is the volatility of the entire market. Every stock in the market is exposed to this volatility, which is linked to the fact that stocks prices are correlated in an efficient market.
Some stocks mimic the volatility of the market quite closely, while others demonstrate muted, exagerrated or uncorrelated price movements. Some investors use beta as a measure of how much a certain stock is impacted by market risk (volatility). While we should keep in mind that Warren Buffett has cautioned that ‘Volatility is far from synonymous with risk’, beta is still a useful factor to consider. To make good use of it you must first know that the beta of the overall market is one. Any stock with a beta of greater than one is considered more volatile than the market, while those with a beta below one are either less volatile or poorly correlated with the market.
Check out our latest analysis for Grainger
Want to help shape the future of investing tools and platforms? Take the survey and be part of one of the most advanced studies of stock market investors to date.
What GRI’s beta value tells investors
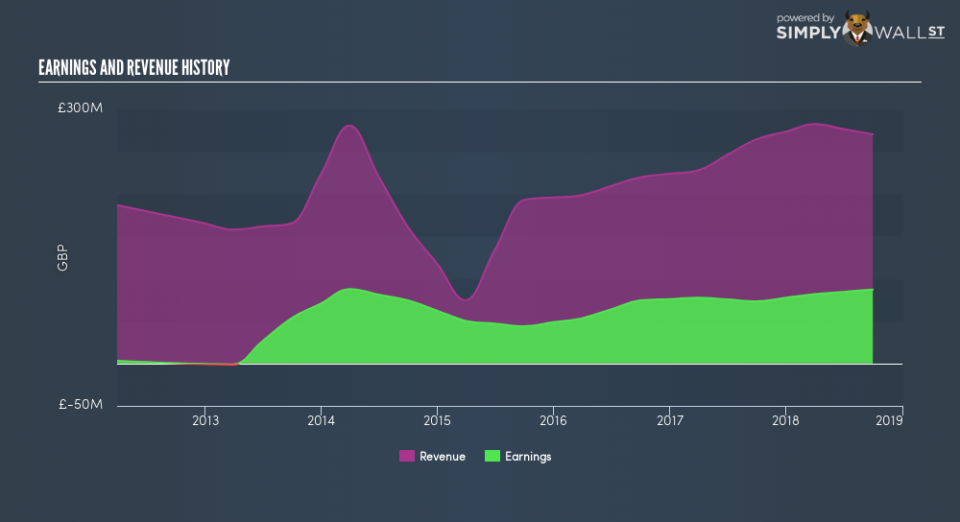
Zooming in on Grainger, we see it has a five year beta of 0.85. This is below 1, so historically its share price has been rather independent from the market. This means that — if history is a guide — buying the stock would reduce the impact of overall market volatility in many portfolios (depending on the beta of the portfolio, of course). Many would argue that beta is useful in position sizing, but fundamental metrics such as revenue and earnings are more important overall. You can see Grainger’s revenue and earnings in the image below.
Does GRI’s size influence the expected beta?
Grainger is a small cap stock with a market capitalisation of UK£1.3b. Most companies this size are actively traded. Small cap stocks ofthen have a higher beta than the overall market. However, small companies can also be strongly impacted by company specific developments, which can move the share price in ways that are unrelated to the broader market. That could explain why this one has a low beta value.
What this means for you:
Since Grainger is not heavily influenced by market moves, its share price is probably far more dependend on company specific developments. It could pay to take a closer look at metrics such as revenue growth, earnings growth, and debt. This article aims to educate investors about beta values, but it’s well worth looking at important company-specific fundamentals such as Grainger’s financial health and performance track record. I highly recommend you dive deeper by considering the following:
Future Outlook: What are well-informed industry analysts predicting for GRI’s future growth? Take a look at our free research report of analyst consensus for GRI’s outlook.
Past Track Record: Has GRI been consistently performing well irrespective of the ups and downs in the market? Go into more detail in the past performance analysis and take a look at the free visual representations of GRI’s historicals for more clarity.
Other Interesting Stocks: It’s worth checking to see how GRI measures up against other companies on valuation. You could start with this free list of prospective options.
To help readers see past the short term volatility of the financial market, we aim to bring you a long-term focused research analysis purely driven by fundamental data. Note that our analysis does not factor in the latest price-sensitive company announcements.
The author is an independent contributor and at the time of publication had no position in the stocks mentioned. For errors that warrant correction please contact the editor at editorial-team@simplywallst.com.
