
 Yahoo Finance
 The one-year underlying earnings growth at Grafton Group (LON:GFTU) is promising, but the shareholders are still in the red over that time
Investors can approximate the average market return by buying an index fund. When you buy individual stocks, you can make higher profits, but you also face the risk of under-performance. Investors in Grafton Group plc (LON:GFTU) have tasted that bitter downside in the last year, as the share price dropped 43%. That falls noticeably short of the market decline of around 7.5%. At least the damage isn't so bad if you look at the last three years, since the stock is down 8.7% in that time. Shareholders have had an even rougher run lately, with the share price down 27% in the last 90 days.
Given the past week has been tough on shareholders, let's investigate the fundamentals and see what we can learn.
View our latest analysis for Grafton Group
While the efficient markets hypothesis continues to be taught by some, it has been proven that markets are over-reactive dynamic systems, and investors are not always rational. One flawed but reasonable way to assess how sentiment around a company has changed is to compare the earnings per share (EPS) with the share price.
During the unfortunate twelve months during which the Grafton Group share price fell, it actually saw its earnings per share (EPS) improve by 88%. Of course, the situation might betray previous over-optimism about growth.
It's surprising to see the share price fall so much, despite the improved EPS. So it's easy to justify a look at some other metrics.
Grafton Group's dividend seems healthy to us, so we doubt that the yield is a concern for the market. From what we can see, revenue is pretty flat, so that doesn't really explain the share price drop. Of course, it could simply be that it simply fell short of the market consensus expectations.
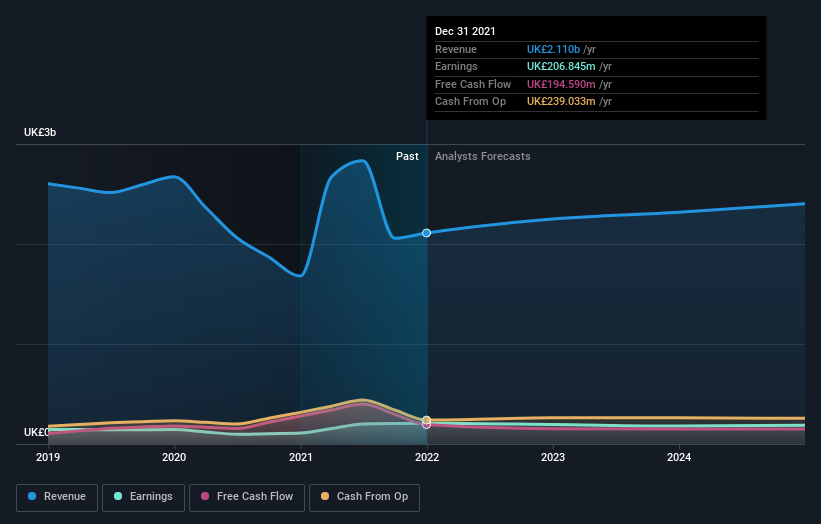
The graphic below depicts how earnings and revenue have changed over time (unveil the exact values by clicking on the image).
Grafton Group is a well known stock, with plenty of analyst coverage, suggesting some visibility into future growth. So it makes a lot of sense to check out what analysts think Grafton Group will earn in the future (free analyst consensus estimates)
A Different Perspective
While the broader market lost about 7.5% in the twelve months, Grafton Group shareholders did even worse, losing 41% (even including dividends). Having said that, it's inevitable that some stocks will be oversold in a falling market. The key is to keep your eyes on the fundamental developments. Longer term investors wouldn't be so upset, since they would have made 2%, each year, over five years. It could be that the recent sell-off is an opportunity, so it may be worth checking the fundamental data for signs of a long term growth trend. It's always interesting to track share price performance over the longer term. But to understand Grafton Group better, we need to consider many other factors. Even so, be aware that Grafton Group is showing 2 warning signs in our investment analysis , and 1 of those is a bit unpleasant...
For those who like to find winning investments this free list of growing companies with recent insider purchasing, could be just the ticket.
Please note, the market returns quoted in this article reflect the market weighted average returns of stocks that currently trade on GB exchanges.
Have feedback on this article? Concerned about the content? Get in touch with us directly. Alternatively, email editorial-team (at) simplywallst.com.
This article by Simply Wall St is general in nature. We provide commentary based on historical data and analyst forecasts only using an unbiased methodology and our articles are not intended to be financial advice. It does not constitute a recommendation to buy or sell any stock, and does not take account of your objectives, or your financial situation. We aim to bring you long-term focused analysis driven by fundamental data. Note that our analysis may not factor in the latest price-sensitive company announcements or qualitative material. Simply Wall St has no position in any stocks mentioned.
