
 Yahoo Finance
 Open Text (NASDAQ:OTEX) Has More To Do To Multiply In Value Going Forward
What trends should we look for it we want to identify stocks that can multiply in value over the long term? Typically, we'll want to notice a trend of growing return on capital employed (ROCE) and alongside that, an expanding base of capital employed. Basically this means that a company has profitable initiatives that it can continue to reinvest in, which is a trait of a compounding machine. In light of that, when we looked at Open Text (NASDAQ:OTEX) and its ROCE trend, we weren't exactly thrilled.
Return On Capital Employed (ROCE): What Is It?
For those who don't know, ROCE is a measure of a company's yearly pre-tax profit (its return), relative to the capital employed in the business. To calculate this metric for Open Text, this is the formula:
Return on Capital Employed = Earnings Before Interest and Tax (EBIT) ÷ (Total Assets - Current Liabilities)
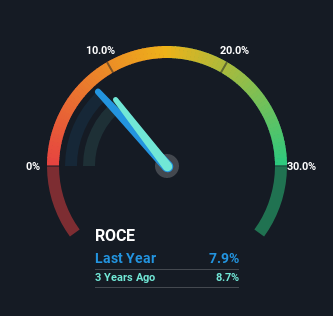
0.079 = US$667m ÷ (US$10b - US$1.6b) (Based on the trailing twelve months to September 2022).
So, Open Text has an ROCE of 7.9%. In absolute terms, that's a low return and it also under-performs the Software industry average of 10%.
See our latest analysis for Open Text
Above you can see how the current ROCE for Open Text compares to its prior returns on capital, but there's only so much you can tell from the past. If you'd like, you can check out the forecasts from the analysts covering Open Text here for free.
What Can We Tell From Open Text's ROCE Trend?
In terms of Open Text's historical ROCE trend, it doesn't exactly demand attention. The company has consistently earned 7.9% for the last five years, and the capital employed within the business has risen 33% in that time. Given the company has increased the amount of capital employed, it appears the investments that have been made simply don't provide a high return on capital.
What We Can Learn From Open Text's ROCE
In conclusion, Open Text has been investing more capital into the business, but returns on that capital haven't increased. Additionally, the stock's total return to shareholders over the last five years has been flat, which isn't too surprising. In any case, the stock doesn't have these traits of a multi-bagger discussed above, so if that's what you're looking for, we think you'd have more luck elsewhere.
If you want to continue researching Open Text, you might be interested to know about the 4 warning signs that our analysis has discovered.
If you want to search for solid companies with great earnings, check out this free list of companies with good balance sheets and impressive returns on equity.
Have feedback on this article? Concerned about the content? Get in touch with us directly. Alternatively, email editorial-team (at) simplywallst.com.
This article by Simply Wall St is general in nature. We provide commentary based on historical data and analyst forecasts only using an unbiased methodology and our articles are not intended to be financial advice. It does not constitute a recommendation to buy or sell any stock, and does not take account of your objectives, or your financial situation. We aim to bring you long-term focused analysis driven by fundamental data. Note that our analysis may not factor in the latest price-sensitive company announcements or qualitative material. Simply Wall St has no position in any stocks mentioned.
Join A Paid User Research Session
You’ll receive a US$30 Amazon Gift card for 1 hour of your time while helping us build better investing tools for the individual investors like yourself. Sign up here
