
 Yahoo Finance
 OPG Power Ventures (LON:OPG) Is Looking To Continue Growing Its Returns On Capital
What are the early trends we should look for to identify a stock that could multiply in value over the long term? One common approach is to try and find a company with returns on capital employed (ROCE) that are increasing, in conjunction with a growing amount of capital employed. If you see this, it typically means it's a company with a great business model and plenty of profitable reinvestment opportunities. Speaking of which, we noticed some great changes in OPG Power Ventures' (LON:OPG) returns on capital, so let's have a look.
Return On Capital Employed (ROCE): What Is It?
Just to clarify if you're unsure, ROCE is a metric for evaluating how much pre-tax income (in percentage terms) a company earns on the capital invested in its business. Analysts use this formula to calculate it for OPG Power Ventures:
Return on Capital Employed = Earnings Before Interest and Tax (EBIT) ÷ (Total Assets - Current Liabilities)
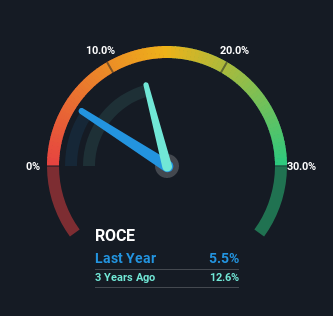
0.055 = UK£11m ÷ (UK£281m - UK£73m) (Based on the trailing twelve months to September 2022).
Therefore, OPG Power Ventures has an ROCE of 5.5%. Ultimately, that's a low return and it under-performs the Electric Utilities industry average of 8.4%.
See our latest analysis for OPG Power Ventures
Above you can see how the current ROCE for OPG Power Ventures compares to its prior returns on capital, but there's only so much you can tell from the past. If you'd like to see what analysts are forecasting going forward, you should check out our free report for OPG Power Ventures.
What Does the ROCE Trend For OPG Power Ventures Tell Us?
We're pretty happy with how the ROCE has been trending at OPG Power Ventures. We found that the returns on capital employed over the last five years have risen by 29%. That's not bad because this tells for every dollar invested (capital employed), the company is increasing the amount earned from that dollar. Interestingly, the business may be becoming more efficient because it's applying 55% less capital than it was five years ago. A business that's shrinking its asset base like this isn't usually typical of a soon to be multi-bagger company.
In Conclusion...
From what we've seen above, OPG Power Ventures has managed to increase it's returns on capital all the while reducing it's capital base. Given the stock has declined 60% in the last five years, this could be a good investment if the valuation and other metrics are also appealing. That being the case, research into the company's current valuation metrics and future prospects seems fitting.
OPG Power Ventures does have some risks, we noticed 2 warning signs (and 1 which is a bit concerning) we think you should know about.
While OPG Power Ventures isn't earning the highest return, check out this free list of companies that are earning high returns on equity with solid balance sheets.
Have feedback on this article? Concerned about the content? Get in touch with us directly. Alternatively, email editorial-team (at) simplywallst.com.
This article by Simply Wall St is general in nature. We provide commentary based on historical data and analyst forecasts only using an unbiased methodology and our articles are not intended to be financial advice. It does not constitute a recommendation to buy or sell any stock, and does not take account of your objectives, or your financial situation. We aim to bring you long-term focused analysis driven by fundamental data. Note that our analysis may not factor in the latest price-sensitive company announcements or qualitative material. Simply Wall St has no position in any stocks mentioned.
Join A Paid User Research Session
You’ll receive a US$30 Amazon Gift card for 1 hour of your time while helping us build better investing tools for the individual investors like yourself. Sign up here
