
 Yahoo Finance
 Is There An Opportunity With BAUER Aktiengesellschaft’s (ETR:B5A) 26.81% Undervaluation?

How far off is BAUER Aktiengesellschaft (ETR:B5A) from its intrinsic value? Using the most recent financial data, I am going to take a look at whether the stock is fairly priced by taking the expected future cash flows and discounting them to today’s value. I will use the Discounted Cash Flows (DCF) model. Don’t get put off by the jargon, the math behind it is actually quite straightforward. If you want to learn more about discounted cash flow, the basis for my calcs can be read in detail in the Simply Wall St analysis model. If you are reading this and its not November 2018 then I highly recommend you check out the latest calculation for BAUER by following the link below.
Check out our latest analysis for BAUER
The model
I use what is known as a 2-stage model, which simply means we have two different periods of varying growth rates for the company’s cash flows. Generally the first stage is higher growth, and the second stage is a more stable growth phase. To start off with we need to estimate the next five years of cash flows. For this I used the consensus of the analysts covering the stock, as you can see below. The sum of these cash flows is then discounted to today’s value.
5-year cash flow forecast
2019 | 2020 | 2021 | 2022 | 2023 | |
Levered FCF (€, Millions) | €45.79 | €39.20 | €50.60 | €52.08 | €53.60 |
Source | Analyst x3 | Analyst x3 | Analyst x1 | Est @ 2.92% | Est @ 2.92% |
Present Value Discounted @ 15.59% | €39.62 | €29.34 | €32.77 | €29.18 | €25.98 |
Present Value of 5-year Cash Flow (PVCF)= €157m
After calculating the present value of future cash flows in the intial 5-year period we need to calculate the Terminal Value, which accounts for all the future cash flows beyond the first stage. The Gordon Growth formula is used to calculate Terminal Value at an annual growth rate equal to the 10-year government bond rate of 0.5%. We discount this to today’s value at a cost of equity of 15.6%.
Terminal Value (TV) = FCF2022 × (1 + g) ÷ (r – g) = €54m × (1 + 0.5%) ÷ (15.6% – 0.5%) = €358m
Present Value of Terminal Value (PVTV) = TV / (1 + r)5 = €358m ÷ ( 1 + 15.6%)5 = €174m
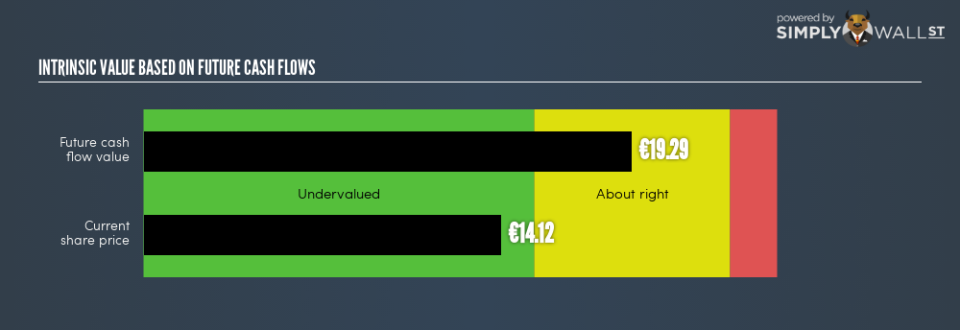
The total value, or equity value, is then the sum of the present value of the cash flows, which in this case is €330m. In the final step we divide the equity value by the number of shares outstanding. If the stock is an depositary receipt (represents a specified number of shares in a foreign corporation) or ADR then we use the equivalent number. This results in an intrinsic value of €19.29. Relative to the current share price of €14.12, the stock is about right, perhaps slightly undervalued at a 27% discount to what it is available for right now.
Important assumptions
Now the most important inputs to a discounted cash flow are the discount rate, and of course, the actual cash flows. You don’t have to agree with my inputs, I recommend redoing the calculations yourself and playing with them. Because we are looking at BAUER as potential shareholders, the cost of equity is used as the discount rate, rather than the cost of capital (or weighed average cost of capital, WACC) which accounts for debt. In this calculation I’ve used 15.6%, which is based on a levered beta of 1.591. This is derived from the Bottom-Up Beta method based on comparable companies, with an imposed limit between 0.8 and 2.0, which is a reasonable range for a stable business.
Next Steps:
Valuation is only one side of the coin in terms of building your investment thesis, and it shouldn’t be the only metric you look at when researching a company. What is the reason for the share price to differ from the intrinsic value? For B5A, there are three essential factors you should further examine:
Financial Health: Does B5A have a healthy balance sheet? Take a look at our free balance sheet analysis with six simple checks on key factors like leverage and risk.
Future Earnings: How does B5A’s growth rate compare to its peers and the wider market? Dig deeper into the analyst consensus number for the upcoming years by interacting with our free analyst growth expectation chart.
Other High Quality Alternatives: Are there other high quality stocks you could be holding instead of B5A? Explore our interactive list of high quality stocks to get an idea of what else is out there you may be missing!
PS. The Simply Wall St app conducts a discounted cash flow for every stock on the ETR every 6 hours. If you want to find the calculation for other stocks just search here.
To help readers see past the short term volatility of the financial market, we aim to bring you a long-term focused research analysis purely driven by fundamental data. Note that our analysis does not factor in the latest price-sensitive company announcements.
The author is an independent contributor and at the time of publication had no position in the stocks mentioned. For errors that warrant correction please contact the editor at editorial-team@simplywallst.com.
