
 Yahoo Finance
 Is There An Opportunity With Lancashire Holdings Limited’s (LON:LRE) Mispricing?

Pricing LRE, a financial stock, can be difficult since these insurance businesses have cash flows that are affected by regulations that are not imposed upon other sectors. For example, insurance companies are required to hold more capital to reduce the risk to shareholders. Examining factors such as book values, as well as the return and cost of equity, may be beneficial for estimating LRE’s valuation. Below I will show you how to value LRE in a fairly useful and straightforward method.
Check out our latest analysis for Lancashire Holdings
Want to participate in a short research study? Help shape the future of investing tools and receive a $60 prize!
Why Excess Return Model?
There are two facets to consider: regulation and type of assets. United Kingdom’s financial regulatory environment is relatively strict. Furthermore, insurance companies tend to not hold significant portions of physical assets as part of total assets. As traditional valuation models put weight on inputs such as capex and depreciation, which is less meaningful for finacial firms, the Excess Return model places importance on forecasting stable earnings and book values.
How Does It Work?
The central belief for this model is, the value of the company is how much money it can generate from its current level of equity capital, in excess of the cost of that capital. The returns above the cost of equity is known as excess returns:
Excess Return Per Share = (Stable Return On Equity – Cost Of Equity) (Book Value Of Equity Per Share)
= (0.13% – 8.2%) x $5.54 = $0.26
We use this value to calculate the terminal value of the company, which is how much we expect the company to continue to earn every year, forever. This is a common component of discounted cash flow models:
Terminal Value Per Share = Excess Return Per Share / (Cost of Equity – Expected Growth Rate)
= $0.26 / (8.2% – 1.2%) = $3.68
Putting this all together, we get the value of LRE’s share:
Value Per Share = Book Value of Equity Per Share + Terminal Value Per Share
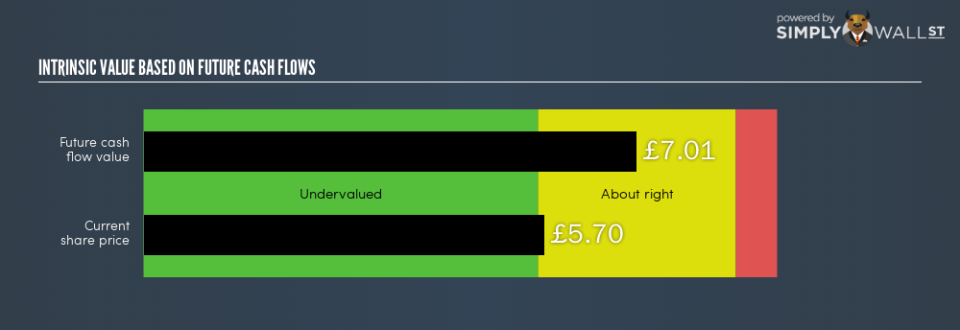
= $5.54 + $3.68 = $9.22 (£7.01)
This results in an intrinsic value of £7.01. Given LRE’s current share price of UK£5.70, LRE is currently fairly priced by the market. Therefore, there’s a bit of a downside if you were to buy LRE today. Valuation is only one side of the coin when you’re looking to invest, or sell, LRE. Analyzing fundamental factors are equally important when it comes to determining if LRE has a place in your holdings.
Next Steps:
For insurance companies, there are three key aspects you should look at:
Financial health: Does it have a healthy balance sheet? Take a look at our free bank analysis with six simple checks on things like leverage and risk.
Future earnings: What does the market think of LRE going forward? Our analyst growth expectation chart helps visualize LRE’s growth potential over the upcoming years.
Dividends: Most people buy financial stocks for their healthy and stable dividends. Check out whether LRE is a dividend Rockstar with our historical and future dividend analysis.
For more details and sources, take a look at our full calculation on LRE here.
To help readers see past the short term volatility of the financial market, we aim to bring you a long-term focused research analysis purely driven by fundamental data. Note that our analysis does not factor in the latest price-sensitive company announcements.
The author is an independent contributor and at the time of publication had no position in the stocks mentioned. For errors that warrant correction please contact the editor at editorial-team@simplywallst.com.