
 Yahoo Finance
 Optimism around Inchcape (LON:INCH) delivering new earnings growth may be shrinking as stock declines 7.8% this past week
For many, the main point of investing is to generate higher returns than the overall market. But the main game is to find enough winners to more than offset the losers So we wouldn't blame long term Inchcape plc (LON:INCH) shareholders for doubting their decision to hold, with the stock down 15% over a half decade. On top of that, the share price is down 7.8% in the last week. However, this move may have been influenced by the broader market, which fell 5.4% in that time.
With the stock having lost 7.8% in the past week, it's worth taking a look at business performance and seeing if there's any red flags.
View our latest analysis for Inchcape
While the efficient markets hypothesis continues to be taught by some, it has been proven that markets are over-reactive dynamic systems, and investors are not always rational. By comparing earnings per share (EPS) and share price changes over time, we can get a feel for how investor attitudes to a company have morphed over time.
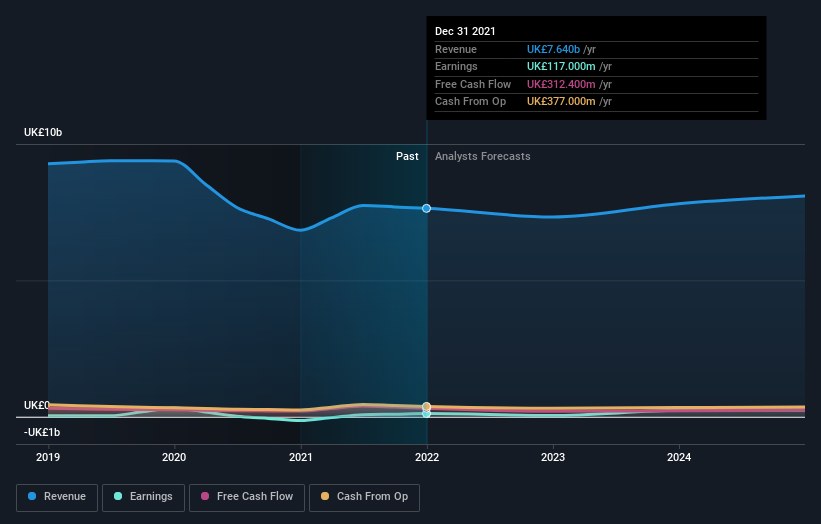
Inchcape became profitable within the last five years. That would generally be considered a positive, so we are surprised to see the share price is down. Other metrics may better explain the share price move.
Arguably, the revenue drop of 3.2% a year for half a decade suggests that the company can't grow in the long term. This has probably encouraged some shareholders to sell down the stock.
The image below shows how earnings and revenue have tracked over time (if you click on the image you can see greater detail).
We know that Inchcape has improved its bottom line over the last three years, but what does the future have in store? If you are thinking of buying or selling Inchcape stock, you should check out this FREE detailed report on its balance sheet.
What About Dividends?
It is important to consider the total shareholder return, as well as the share price return, for any given stock. The TSR is a return calculation that accounts for the value of cash dividends (assuming that any dividend received was reinvested) and the calculated value of any discounted capital raisings and spin-offs. So for companies that pay a generous dividend, the TSR is often a lot higher than the share price return. We note that for Inchcape the TSR over the last 5 years was -2.5%, which is better than the share price return mentioned above. This is largely a result of its dividend payments!
A Different Perspective
While the broader market lost about 4.7% in the twelve months, Inchcape shareholders did even worse, losing 9.2% (even including dividends). However, it could simply be that the share price has been impacted by broader market jitters. It might be worth keeping an eye on the fundamentals, in case there's a good opportunity. Unfortunately, last year's performance may indicate unresolved challenges, given that it was worse than the annualised loss of 0.5% over the last half decade. We realise that Baron Rothschild has said investors should "buy when there is blood on the streets", but we caution that investors should first be sure they are buying a high quality business. It's always interesting to track share price performance over the longer term. But to understand Inchcape better, we need to consider many other factors. For example, we've discovered 2 warning signs for Inchcape that you should be aware of before investing here.
But note: Inchcape may not be the best stock to buy. So take a peek at this free list of interesting companies with past earnings growth (and further growth forecast).
Please note, the market returns quoted in this article reflect the market weighted average returns of stocks that currently trade on GB exchanges.
Have feedback on this article? Concerned about the content? Get in touch with us directly. Alternatively, email editorial-team (at) simplywallst.com.
This article by Simply Wall St is general in nature. We provide commentary based on historical data and analyst forecasts only using an unbiased methodology and our articles are not intended to be financial advice. It does not constitute a recommendation to buy or sell any stock, and does not take account of your objectives, or your financial situation. We aim to bring you long-term focused analysis driven by fundamental data. Note that our analysis may not factor in the latest price-sensitive company announcements or qualitative material. Simply Wall St has no position in any stocks mentioned.
