
 Yahoo Finance
 Optimism for Boston Properties (NYSE:BXP) has grown this past week, despite one-year decline in earnings
On average, over time, stock markets tend to rise higher. This makes investing attractive. But if you choose that path, you're going to buy some stocks that fall short of the market. For example, the Boston Properties, Inc. (NYSE:BXP), share price is up over the last year, but its gain of 27% trails the market return. Zooming out, the stock is actually down 5.8% in the last three years.
Since the stock has added US$572m to its market cap in the past week alone, let's see if underlying performance has been driving long-term returns.
See our latest analysis for Boston Properties
To quote Buffett, 'Ships will sail around the world but the Flat Earth Society will flourish. There will continue to be wide discrepancies between price and value in the marketplace...' By comparing earnings per share (EPS) and share price changes over time, we can get a feel for how investor attitudes to a company have morphed over time.
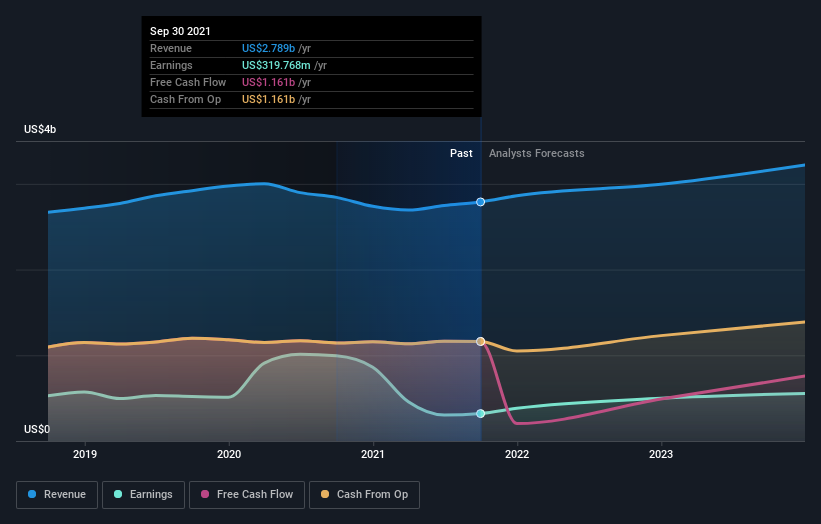
During the last year, Boston Properties actually saw its earnings per share drop 68%.
Given the share price gain, we doubt the market is measuring progress with EPS. Therefore, it seems likely that investors are putting more weight on metrics other than EPS, at the moment.
Revenue was pretty stable on last year, so deeper research might be needed to explain the share price rise.
The graphic below depicts how earnings and revenue have changed over time (unveil the exact values by clicking on the image).
Take a more thorough look at Boston Properties' financial health with this free report on its balance sheet.
What About Dividends?
As well as measuring the share price return, investors should also consider the total shareholder return (TSR). The TSR is a return calculation that accounts for the value of cash dividends (assuming that any dividend received was reinvested) and the calculated value of any discounted capital raisings and spin-offs. So for companies that pay a generous dividend, the TSR is often a lot higher than the share price return. In the case of Boston Properties, it has a TSR of 32% for the last 1 year. That exceeds its share price return that we previously mentioned. This is largely a result of its dividend payments!
A Different Perspective
Boston Properties' TSR for the year was broadly in line with the market average, at 32%. That gain looks pretty satisfying, and it is even better than the five-year TSR of 2% per year. Even if the share price growth slows down from here, there's a good chance that this is business worth watching in the long term. I find it very interesting to look at share price over the long term as a proxy for business performance. But to truly gain insight, we need to consider other information, too. To that end, you should learn about the 3 warning signs we've spotted with Boston Properties (including 1 which is concerning) .
If you like to buy stocks alongside management, then you might just love this free list of companies. (Hint: insiders have been buying them).
Please note, the market returns quoted in this article reflect the market weighted average returns of stocks that currently trade on US exchanges.
This article by Simply Wall St is general in nature. We provide commentary based on historical data and analyst forecasts only using an unbiased methodology and our articles are not intended to be financial advice. It does not constitute a recommendation to buy or sell any stock, and does not take account of your objectives, or your financial situation. We aim to bring you long-term focused analysis driven by fundamental data. Note that our analysis may not factor in the latest price-sensitive company announcements or qualitative material. Simply Wall St has no position in any stocks mentioned.
Have feedback on this article? Concerned about the content? Get in touch with us directly. Alternatively, email editorial-team (at) simplywallst.com.
