
 Yahoo Finance
 Optimism for Guan Chong Berhad (KLSE:GCB) has grown this past week, despite five-year decline in earnings
Stock pickers are generally looking for stocks that will outperform the broader market. And while active stock picking involves risks (and requires diversification) it can also provide excess returns. For example, the Guan Chong Berhad (KLSE:GCB) share price is up 36% in the last 5 years, clearly besting the market return of around 0.1% (ignoring dividends). However, more recent returns haven't been as impressive as that, with the stock returning just 4.4% in the last year , including dividends .
Since it's been a strong week for Guan Chong Berhad shareholders, let's have a look at trend of the longer term fundamentals.
Check out our latest analysis for Guan Chong Berhad
While markets are a powerful pricing mechanism, share prices reflect investor sentiment, not just underlying business performance. One way to examine how market sentiment has changed over time is to look at the interaction between a company's share price and its earnings per share (EPS).
During five years of share price growth, Guan Chong Berhad actually saw its EPS drop 15% per year.
This means it's unlikely the market is judging the company based on earnings growth. Because earnings per share don't seem to match up with the share price, we'll take a look at other metrics instead.
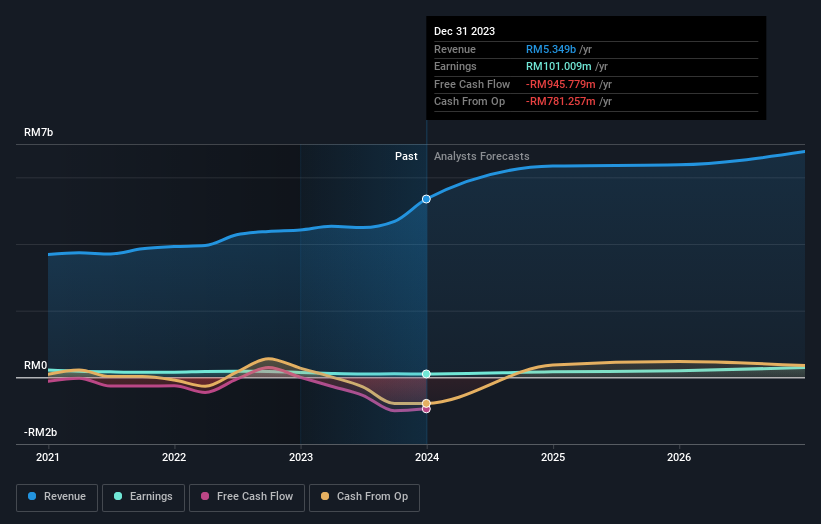
The modest 0.8% dividend yield is unlikely to be propping up the share price. On the other hand, Guan Chong Berhad's revenue is growing nicely, at a compound rate of 14% over the last five years. It's quite possible that management are prioritizing revenue growth over EPS growth at the moment.
You can see below how earnings and revenue have changed over time (discover the exact values by clicking on the image).
If you are thinking of buying or selling Guan Chong Berhad stock, you should check out this FREE detailed report on its balance sheet.
What About Dividends?
When looking at investment returns, it is important to consider the difference between total shareholder return (TSR) and share price return. Whereas the share price return only reflects the change in the share price, the TSR includes the value of dividends (assuming they were reinvested) and the benefit of any discounted capital raising or spin-off. It's fair to say that the TSR gives a more complete picture for stocks that pay a dividend. We note that for Guan Chong Berhad the TSR over the last 5 years was 45%, which is better than the share price return mentioned above. And there's no prize for guessing that the dividend payments largely explain the divergence!
A Different Perspective
Guan Chong Berhad provided a TSR of 4.4% over the last twelve months. Unfortunately this falls short of the market return. It's probably a good sign that the company has an even better long term track record, having provided shareholders with an annual TSR of 8% over five years. It may well be that this is a business worth popping on the watching, given the continuing positive reception, over time, from the market. It's always interesting to track share price performance over the longer term. But to understand Guan Chong Berhad better, we need to consider many other factors. Take risks, for example - Guan Chong Berhad has 3 warning signs (and 2 which don't sit too well with us) we think you should know about.
If you are like me, then you will not want to miss this free list of growing companies that insiders are buying.
Please note, the market returns quoted in this article reflect the market weighted average returns of stocks that currently trade on Malaysian exchanges.
Have feedback on this article? Concerned about the content? Get in touch with us directly. Alternatively, email editorial-team (at) simplywallst.com.
This article by Simply Wall St is general in nature. We provide commentary based on historical data and analyst forecasts only using an unbiased methodology and our articles are not intended to be financial advice. It does not constitute a recommendation to buy or sell any stock, and does not take account of your objectives, or your financial situation. We aim to bring you long-term focused analysis driven by fundamental data. Note that our analysis may not factor in the latest price-sensitive company announcements or qualitative material. Simply Wall St has no position in any stocks mentioned.
