
 Yahoo Finance
 Orascom Development Holding's (VTX:ODHN) Returns On Capital Are Heading Higher
To find a multi-bagger stock, what are the underlying trends we should look for in a business? Typically, we'll want to notice a trend of growing return on capital employed (ROCE) and alongside that, an expanding base of capital employed. If you see this, it typically means it's a company with a great business model and plenty of profitable reinvestment opportunities. With that in mind, we've noticed some promising trends at Orascom Development Holding (VTX:ODHN) so let's look a bit deeper.
Return On Capital Employed (ROCE): What Is It?
For those that aren't sure what ROCE is, it measures the amount of pre-tax profits a company can generate from the capital employed in its business. To calculate this metric for Orascom Development Holding, this is the formula:
Return on Capital Employed = Earnings Before Interest and Tax (EBIT) ÷ (Total Assets - Current Liabilities)
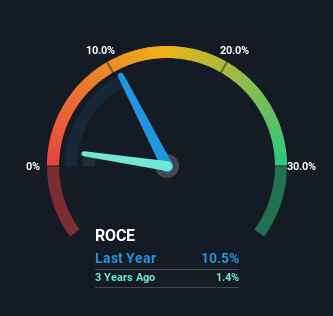
0.10 = CHF117m ÷ (CHF1.8b - CHF734m) (Based on the trailing twelve months to December 2023).
Therefore, Orascom Development Holding has an ROCE of 10%. On its own, that's a standard return, however it's much better than the 7.4% generated by the Hospitality industry.
See our latest analysis for Orascom Development Holding
Above you can see how the current ROCE for Orascom Development Holding compares to its prior returns on capital, but there's only so much you can tell from the past. If you'd like to see what analysts are forecasting going forward, you should check out our free analyst report for Orascom Development Holding .
So How Is Orascom Development Holding's ROCE Trending?
Orascom Development Holding's ROCE growth is quite impressive. Looking at the data, we can see that even though capital employed in the business has remained relatively flat, the ROCE generated has risen by 214% over the last five years. So our take on this is that the business has increased efficiencies to generate these higher returns, all the while not needing to make any additional investments. The company is doing well in that sense, and it's worth investigating what the management team has planned for long term growth prospects.
On a side note, we noticed that the improvement in ROCE appears to be partly fueled by an increase in current liabilities. Essentially the business now has suppliers or short-term creditors funding about 40% of its operations, which isn't ideal. Keep an eye out for future increases because when the ratio of current liabilities to total assets gets particularly high, this can introduce some new risks for the business.
In Conclusion...
To bring it all together, Orascom Development Holding has done well to increase the returns it's generating from its capital employed. Although the company may be facing some issues elsewhere since the stock has plunged 73% in the last five years. Still, it's worth doing some further research to see if the trends will continue into the future.
One final note, you should learn about the 3 warning signs we've spotted with Orascom Development Holding (including 1 which is potentially serious) .
While Orascom Development Holding isn't earning the highest return, check out this free list of companies that are earning high returns on equity with solid balance sheets.
Have feedback on this article? Concerned about the content? Get in touch with us directly. Alternatively, email editorial-team (at) simplywallst.com.
This article by Simply Wall St is general in nature. We provide commentary based on historical data and analyst forecasts only using an unbiased methodology and our articles are not intended to be financial advice. It does not constitute a recommendation to buy or sell any stock, and does not take account of your objectives, or your financial situation. We aim to bring you long-term focused analysis driven by fundamental data. Note that our analysis may not factor in the latest price-sensitive company announcements or qualitative material. Simply Wall St has no position in any stocks mentioned.
