
 Yahoo Finance
 O'Reilly Automotive Stock Is Estimated To Be Fairly Valued
- By GF Value
The stock of O'Reilly Automotive (NAS:ORLY, 30-year Financials) appears to be fairly valued, according to GuruFocus Value calculation. GuruFocus Value is GuruFocus' estimate of the fair value at which the stock should be traded. It is calculated based on the historical multiples that the stock has traded at, the past business growth and analyst estimates of future business performance. If the price of a stock is significantly above the GF Value Line, it is overvalued and its future return is likely to be poor. On the other hand, if it is significantly below the GF Value Line, its future return will likely be higher. At its current price of $529.06 per share and the market cap of $36.9 billion, O'Reilly Automotive stock is believed to be fairly valued. GF Value for O'Reilly Automotive is shown in the chart below.
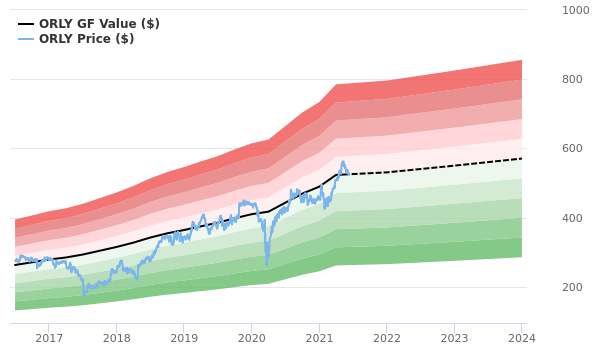
Because O'Reilly Automotive is fairly valued, the long-term return of its stock is likely to be close to the rate of its business growth, which averaged 15.8% over the past three years and is estimated to grow 3.62% annually over the next three to five years.
Link: These companies may deliever higher future returns at reduced risk.
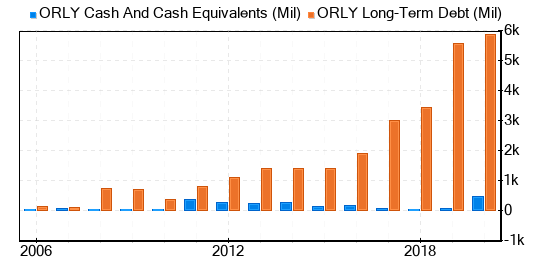
Since investing in companies with low financial strength could result in permanent capital loss, investors must carefully review a company's financial strength before deciding whether to buy shares. Looking at the cash-to-debt ratio and interest coverage can give a good initial perspective on the company's financial strength. O'Reilly Automotive has a cash-to-debt ratio of 0.10, which ranks worse than 87% of the companies in the industry of Retail - Cyclical. Based on this, GuruFocus ranks O'Reilly Automotive's financial strength as 4 out of 10, suggesting poor balance sheet. This is the debt and cash of O'Reilly Automotive over the past years:
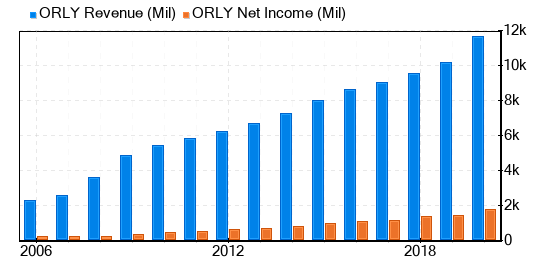
It poses less risk to invest in profitable companies, especially those that have demonstrated consistent profitability over the long term. A company with high profit margins is also typically a safer investment than one with low profit margins. O'Reilly Automotive has been profitable 10 over the past 10 years. Over the past twelve months, the company had a revenue of $12.2 billion and earnings of $26.63 a share. Its operating margin is 21.99%, which ranks better than 95% of the companies in the industry of Retail - Cyclical. Overall, GuruFocus ranks the profitability of O'Reilly Automotive at 9 out of 10, which indicates strong profitability. This is the revenue and net income of O'Reilly Automotive over the past years:
Growth is probably one of the most important factors in the valuation of a company. GuruFocus' research has found that growth is closely correlated with the long-term performance of a company's stock. If a company's business is growing, the company usually creates value for its shareholders, especially if the growth is profitable. Likewise, if a company's revenue and earnings are declining, the value of the company will decrease. O'Reilly Automotive's 3-year average revenue growth rate is better than 87% of the companies in the industry of Retail - Cyclical. O'Reilly Automotive's 3-year average EBITDA growth rate is 18.9%, which ranks better than 72% of the companies in the industry of Retail - Cyclical.
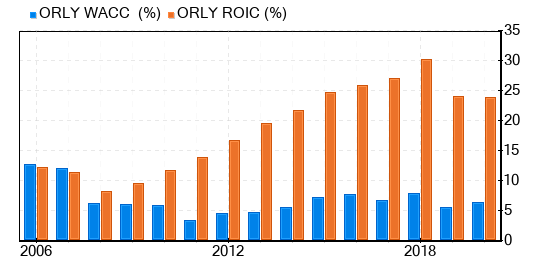
Another way to look at the profitability of a company is to compare its return on invested capital and the weighted cost of capital. Return on invested capital (ROIC) measures how well a company generates cash flow relative to the capital it has invested in its business. The weighted average cost of capital (WACC) is the rate that a company is expected to pay on average to all its security holders to finance its assets. We want to have the return on invested capital higher than the weighted cost of capital. For the past 12 months, O'Reilly Automotive's return on invested capital is 25.52, and its cost of capital is 6.90. The historical ROIC vs WACC comparison of O'Reilly Automotive is shown below:
In summary, The stock of O'Reilly Automotive (NAS:ORLY, 30-year Financials) shows every sign of being fairly valued. The company's financial condition is poor and its profitability is strong. Its growth ranks better than 72% of the companies in the industry of Retail - Cyclical. To learn more about O'Reilly Automotive stock, you can check out its 30-year Financials here.
To find out the high quality companies that may deliever above average returns, please check out GuruFocus High Quality Low Capex Screener.
This article first appeared on GuruFocus.
