
 Yahoo Finance
 Is Oshkosh Corporation (NYSE:OSK) A Financially Strong Company?

Want to participate in a short research study? Help shape the future of investing tools and you could win a $250 gift card!
Mid-caps stocks, like Oshkosh Corporation (NYSE:OSK) with a market capitalization of US$5.8b, aren’t the focus of most investors who prefer to direct their investments towards either large-cap or small-cap stocks. Despite this, commonly overlooked mid-caps have historically produced better risk-adjusted returns than their small and large-cap counterparts. OSK’s financial liquidity and debt position will be analysed in this article, to get an idea of whether the company can fund opportunities for strategic growth and maintain strength through economic downturns. Don’t forget that this is a general and concentrated examination of Oshkosh's financial health, so you should conduct further analysis into OSK here.
See our latest analysis for Oshkosh
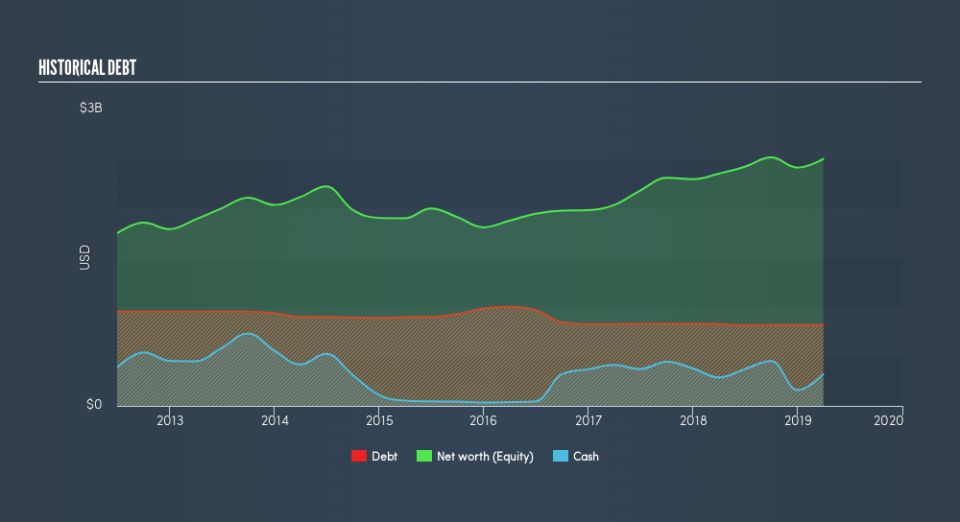
Does OSK Produce Much Cash Relative To Its Debt?
OSK has sustained its debt level by about US$819m over the last 12 months – this includes long-term debt. At this current level of debt, the current cash and short-term investment levels stands at US$322m , ready to be used for running the business. On top of this, OSK has produced US$545m in operating cash flow in the last twelve months, leading to an operating cash to total debt ratio of 67%, meaning that OSK’s debt is appropriately covered by operating cash.
Does OSK’s liquid assets cover its short-term commitments?
With current liabilities at US$1.8b, the company has been able to meet these commitments with a current assets level of US$3.4b, leading to a 1.86x current account ratio. The current ratio is the number you get when you divide current assets by current liabilities. Generally, for Machinery companies, this is a reasonable ratio as there's enough of a cash buffer without holding too much capital in low return investments.
Is OSK’s debt level acceptable?
With debt at 33% of equity, OSK may be thought of as appropriately levered. This range is considered safe as OSK is not taking on too much debt obligation, which may be constraining for future growth. We can test if OSK’s debt levels are sustainable by measuring interest payments against earnings of a company. Ideally, earnings before interest and tax (EBIT) should cover net interest by at least three times. For OSK, the ratio of 12.78x suggests that interest is comfortably covered, which means that lenders may be inclined to lend more money to the company, as it is seen as safe in terms of payback.
Next Steps:
OSK’s high cash coverage and appropriate debt levels indicate its ability to utilise its borrowings efficiently in order to generate ample cash flow. Furthermore, the company will be able to pay all of its upcoming liabilities from its current short-term assets. This is only a rough assessment of financial health, and I'm sure OSK has company-specific issues impacting its capital structure decisions. I suggest you continue to research Oshkosh to get a better picture of the stock by looking at:
Future Outlook: What are well-informed industry analysts predicting for OSK’s future growth? Take a look at our free research report of analyst consensus for OSK’s outlook.
Valuation: What is OSK worth today? Is the stock undervalued, even when its growth outlook is factored into its intrinsic value? The intrinsic value infographic in our free research report helps visualize whether OSK is currently mispriced by the market.
Other High-Performing Stocks: Are there other stocks that provide better prospects with proven track records? Explore our free list of these great stocks here.
We aim to bring you long-term focused research analysis driven by fundamental data. Note that our analysis may not factor in the latest price-sensitive company announcements or qualitative material.
If you spot an error that warrants correction, please contact the editor at editorial-team@simplywallst.com. This article by Simply Wall St is general in nature. It does not constitute a recommendation to buy or sell any stock, and does not take account of your objectives, or your financial situation. Simply Wall St has no position in the stocks mentioned. Thank you for reading.
